There are times when investors should be more aggressive and times to be more conservative. History clearly shows that most investors mistime their aggression. They are scared to invest when the opportunities are greatest and eager to invest as the opportunities dwindle.
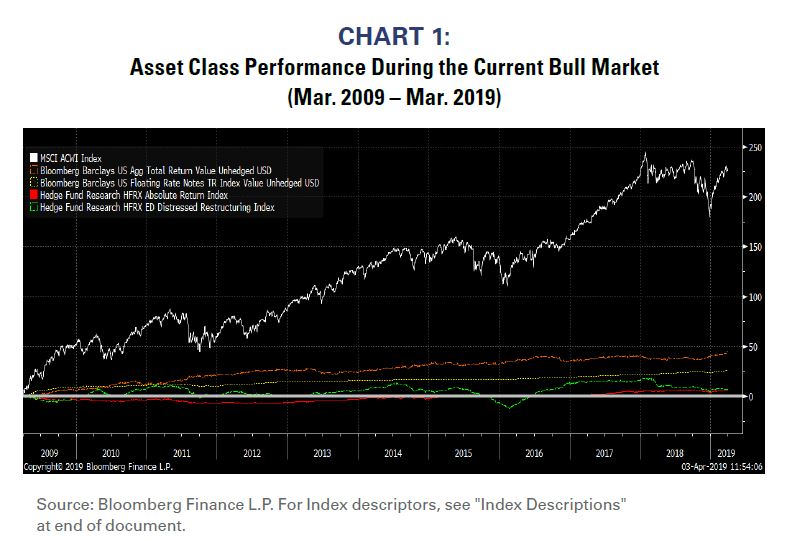
Investors have been overly cautious during most of the bull market, and worried more about preserving capital than searching for opportunities. Individuals invested for “safe” fixed-income instead of equities, and institutions underweighted public equity for more expensive absolute return strategies. Chart 1 demonstrates conservative strategies’ opportunity cost during the bull market was enormous.
The bull market is now more than 10 years old, and investors are finally coming out of their defensive shells. Their typical metamorphosis from bears to bulls once again seems ill-timed. Rather than joining the party at this late hour, investors should be sobering up. It’s time to be your portfolio’s designated driver.

Investors are indeed getting more bullish
Reliable sentiment data show that investors are slowly but surely getting more bullish about equities. Some might say that the absurd valuations investors are paying for “unicorn” IPOs reflects excessive bullishness.
The valuations afforded unicorns and disruptors do seem silly (see our March 2019 report https://www.rbadvisors.com/images/pdfs/Doomed_to_ repeat_the_Tech_Bubble.pdf), but sentiment toward equities as an asset class has been changing more gradually.
Chart 2 shows Wall Street’s consensus recommended asset allocation to stocks within a multi-asset portfolio. Note that Wall Street recommended underweighting equities during the current bull market as they did during the bull markets of the 1980s and 1990s. The only time the Street recommended overweighting equities was during and immediately after the Technology bubble. US equities performed miserably during the following decade.
Wall Street’s recommendation to underweight equities mirrors investors’ anxiety during the past decade’s bull market. Wall Street is still recommending an underweight today, but a more bullish consensus is clearly forming.
Investors are not showing the classic euphoria that accompanies market peaks, but how can investors be more bullish today than at any time in the past 8 years? It makes better sense to be incrementally cautious today when profits are beginning to decelerate and the yield curve is very flat versus 10 years ago when profits were accelerating and the curve was steep.
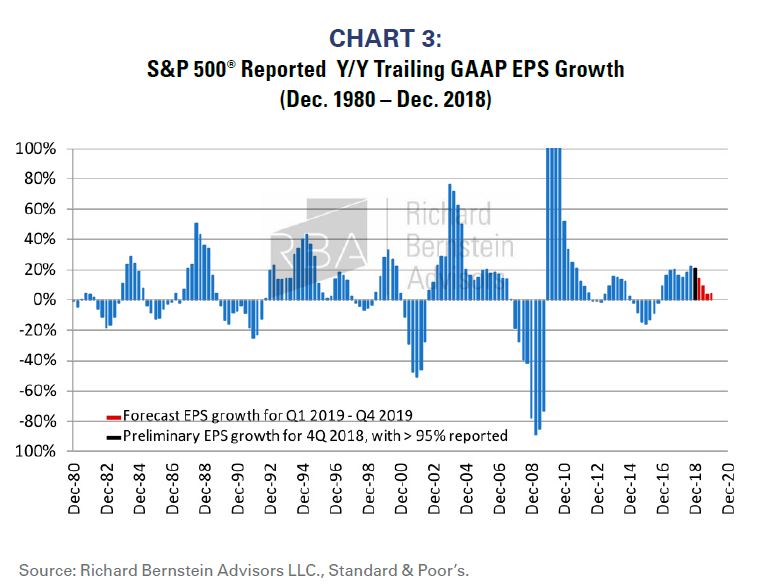
Profits are decelerating
RBA is renowned for our detailed analyses of global corporate profit cycles. Dating back to our original research in the early-1990s, we have shown that profits cycles are more influential to equity performance than are economic cycles.
The US profits cycle is poised to significantly decelerate in 2019. On a GAAP basis, 2018 S&P 500® profits growth exceeded 20%. RBA is forecasting profits growth for 2019 will slow to between 0-5%. The risk of a full-blown profit recession could increase toward the end of the year. Chart 3 shows our forecast for S&P 500® reported GAAP profits growth.
Although some issues (such as trade war resolution) might alter the contour of our forecast, we very strongly doubt that any such issue will totally prevent the profits cycle from decelerating.
Perhaps profits growth slows from 20-25% to 5-10% by year-end because of changes in policy, but the deceleration of corporate profits during 2019 seems certain.
History shows that it is generally beneficial for investors to sober up during periods when profits decelerate. Riskier strategies tend to perform better when profits accelerate.
Liquidity is starting to dry up
Investors also should take a more sober approach because liquidity is starting to dry up. The flat/inverted US yield curve reflects that the credit markets are starting to get more conservative. Perhaps more important, bank lending standards now appear to be tightening.
Chart 4 highlights the Fed’s survey of senior bank lending officers. More lending officers are telling the Fed they are tightening lending standards when the line is above zero and standards are being eased when the line is below zero. The Fed’s most recent survey shows banks are tightening lending standards for the first time in roughly 3 years.
There is plenty of liquidity still available within the economy. This is not a dire situation. However, the flat/inverted yield curve and tighter lending standards may be signaling that investors should be calming down rather than becoming more enthusiastic and taking more risk in their portfolios.
Be the designated driver of your portfolio
It’s never fun being late to a party. Everyone has been having a good time, and you’ve missed out. However, trying to jam all the fun into the party’s last hour is never a sensible idea. It’s probably better to simply admit you were late and be the designated driver for all your party-hardy friends.
The bull market started in March 2009 and is now more than 10 years old. Trying to recoup 10 years of missed excess returns into one’s portfolio at this late date probably isn’t sensible, but the data are suggesting that’s exactly what investors are starting to do.
Investors are always the most bullish in the final stages of a bull market, and then subsequently regret their aggressive imprudence. At RBA, the combination of decelerating corporate profits, liquidity that’s starting to dry up, and investors’ incremental bullishness is starting to signal to us that we should consider being the designated driver at this party. No one knows when the party is going to end, but we feel confident that our budding conservatism will ultimately prove beneficial.
INDEX DESCRIPTIONS:
The following descriptions, while believed to be accurate, are in some cases abbreviated versions of more detailed or comprehensive definitions available from the sponsors or originators of the respective indices. Anyone interested in such further details is free to consult each such sponsor’s or originator’s website.
The past performance of an index is not a guarantee of future results.
Each index reflects an unmanaged universe of securities without any deduction for advisory fees or other expenses that would reduce actual returns, as well
as the reinvestment of all income and dividends. An actual investment in the securities included in the index would require an investor to incur transaction costs, which would lower the performance results. Indices are not actively managed and investors cannot invest directly in the indices.
MSCI ACWI® Index: The MSCI ACWI® Index is a widely recognized, free- float-adjusted, market-capitalization-weighted index designed to measure the equity-market performance of global developed and emerging markets.
Bloomberg Barclays US Aggregate Bond Index: The Bloomberg Barclays US Aggregate Bond Index is a broad-based benchmark that measures the investment grade, US dollar-denominated, fixed-rate taxable bond market. The index includes Treasuries, government-related and corporate securities, MBS (agency fixed-rate and hybrid ARM pass-throughs), ABS and CMBS (agency and non-agency).
Bloomberg Barclays US Floating Rate Notes Index: The Bloomberg Barclays US Floating Rate Notes Index is a broad-based benchmark designed to measure the performance of U.S. dollar-denominated, investment-grade floating rate notes.
Hedge Fund Research HFRX Absolute Return Index: The HFRX Absolute Return Index is designed to be representative of the overall composition of the hedge fund universe. It is comprised of all eligible hedge fund strategies; including but not limited to convertible arbitrage, distressed securities, equity hedge, equity market neutral, event driven, macro, merger arbitrage, and relative value arbitrage.
Hedge Fund Research HFRX ED Distressed Restructuring Index: The Hedge Fund Research HFRX ED Distressed Restructuring Index is designed to be representative of the composition of distressed restructuring firms. HFRX ED Distressed Restructuring Strategies employ an investment process focused on corporate fixed income instruments, primarily on corporate credit instruments of companies trading at significant discounts to their value at issuance or obliged (par value) at maturity as a result of either formal bankruptcy proceeding or financial market perception of near term proceedings. Managers are typically actively involved with the management of these companies, frequently involved on creditors' committees in negotiating the exchange of securities for alternative obligations, either swaps of debt, equity or hybrid securities.
Managers employ fundamental credit processes focused on valuation and asset coverage of securities of distressed firms; in most cases portfolio exposures are concentrated in instruments which are publicly traded, in some cases actively and in others under reduced liquidity but in general for which a reasonable public market exists. In contrast to Special Situations, Distressed Strategies employ primarily debt (greater than 60%) but also may maintain related equity exposure.
© Copyright 2019 Richard Bernstein Advisors LLC. All rights reserved.
PAST PERFORMANCE IS NO GUARANTEE OF FUTURE RESULTS
© Richard Bernstein Advisors
More Tax Planning Topics >