Key Points
-
Leading indicators are at a record high, but in a relatively flat trend over the past year.
-
Manufacturing remains weak, while services/consumer remains healthy; with confidence/employment likely defining whether the divergence persists.
-
Citi’s Economic Surprise Index has shot up, but Bloomberg’s Economic Surprise Index of Leading Indicators has not confirmed.
Each month, on the day of The Conference Board’s release of the Leading Economic Index (LEI) I put together a package of details, including charts and tables. It’s been a while since I shared it with readers of these publications. Leading indicators are always “tells” about the economy looking forward, but they take on increasing importance when late in an economic cycle.
The LEI is made up of 10 components and historically they have done a great job of peaking and rolling over in advance of recessions. In level terms, the LEI is at a record high; however, as you can see in the first chart below, the trajectory over the past year has been fairly flat (a unique condition relative to the past seven cycles, when the peak in the LEI was less of a span over time and more of a point in time).
LEI Level in Flattish Upward Trend

Source: Charles Schwab, Bloomberg, The Conference Board, as of August 31, 2019.
The lack of upward progress can be seen in the year-over-year percentage change version of the chart below. It clearly shows the latest in what has been a trifecta of slowdowns since the economy rebounded out of the 2007-2009 recession.
Trifecta of Mid-cycle Slowdowns?
Source: Charles Schwab, Bloomberg, The Conference Board, as of August 31, 2019.
The relationship between economic data levels and rates of change is always essential to understand. It’s why I’ve always said, when it comes to analyzing economic data (especially as it typically relates to the stock market), it’s crucial to understand that “better or worse tends to matter more than good or bad.” It’s human nature to think of economic data in “good vs. bad” or “strong vs. weak” terms; when we should pay at least as much attention to the data’s rate of change (“better vs. worse”).
What’s important now—obviously—is where the leading indicators go from here. It could be that this is indeed the third meaningful slowdown during this cycle, and that we set to rebound off the near-zero line in year-over-year terms. Or, if the data continues to deteriorate, the likelihood that this move down is indicative of a near-term recession will increase.
Better or worse…
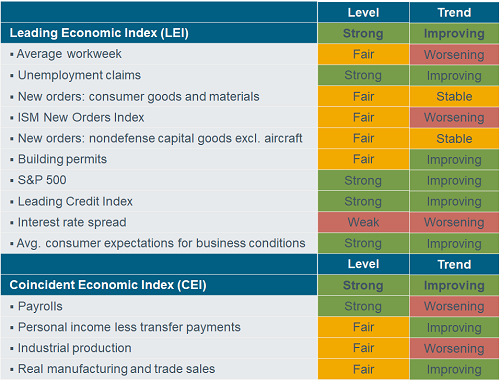
In terms of the latest data, the LEI was unchanged in August. Positive contributions from building permits, the Leading Credit Index, and manufacturing hours worked offset weakness in the manufacturing components and the yield spread. As noted by The Conference Board’s Senior Director of Economic Research, Ataman Ozyildirim: “The recent trends in the LEI are consistent with a slow but still expanding economy, which has been primarily driven by strong consumer spending and robust job growth.”
The table below shows the 10 components that make up the LEI—with both level and trend characteristics. Again, the trend column is at least as important as the level column. As of August, there was enough improvement in the trend of the indicators to turn off the red on two of the “worsening” trend boxes from July. The average workweek moved from worsening to improving; while new orders for capital goods moved from worsening to stable. In the other direction, the overall LEI’s trend moved down to stable; as did unemployment claims, the S&P 500 and consumer expectations.
Source: Charles Schwab, Bloomberg, The Conference Board, as of August 31, 2019.
The net is that the manufacturing side of the economy remains quite weak (although there are some green shoots); while the services/consumer side remains fairly healthy. If the weakness in the former ultimately morphs into weakness in the latter, we will likely see it through the transmission mechanism of employment or sentiment.
Speaking of which, today the Markit “flash” purchasing managers indexes’ (PMIs) were released—covering both the manufacturing and services side of the U.S. economy. Although the headline numbers upticked and were fine, the overall growth rate of the PMI composite in September remained among the weakest since 2016. Prospects look gloomy, as inflows of new business are down to the lowest since 2009, and firms’ expectations of growth over the coming year are the most subdued since 2012. Trade worries and elevated uncertainty continue to be the major headwinds; with jobs now being cut across the surveyed companies.
Within manufacturing, although stronger rates of output and new order growth boosted the headline Markit PMI headline, export orders continued to weaken and manufacturers remained cautious. Within services, Markit showed the slowest rise in new work since October 2009; with the subdued demand resulting in the first reduction in employment in just under 10 years.
Recession not evident by CEI
In the meantime, a broader economic recession doesn’t appear evident. You’ll notice in bottom portion of the table above that I included the four components of The Conference Board’s Coincident Economic Index (CEI); along with their levels and trends. I included those because the four components are, not coincidentally, the four main factors the National Bureau of Economic Research (NBER) analyzes to declare and date recessions. Thanks to last month’s improvement in industrial production (after a string of negative readings), as of August, only payrolls have a worsening trend.
Bloomberg vs. Citi
I keep a close eye on economic surprise indexes, which measure how data is coming in relative to expectations. Just like trend is often more important than level, relative is often more important than absolute. Both Bloomberg and Citigroup have their own Economic Surprise Indexes (ECSU in the case of the former and CESI in the case of the latter). Citi’s is arguably more popular; however I prefer Bloomberg’s.
A recent report from Cornerstone Macro highlighted the difference between the two. Bloomberg’s Economic Surprise Index has sub-indexes for each segment of the U.S. economy; including housing/real estate, industrial, labor market, personal/household, retail/wholesale and surveys/business cycle indicators (aka leading indicators). This means we can look at which segment of the economy is driving the index.
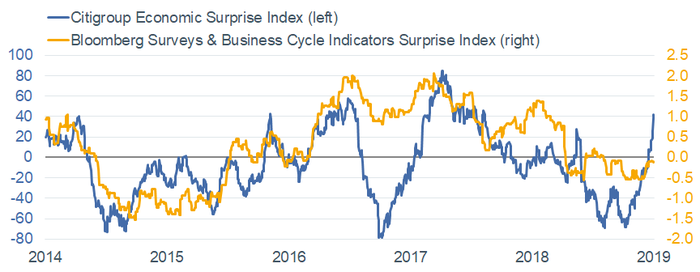
Since this report is on the topic of leading indicators, it may be worth considering that in recent weeks, the CESI has shot higher; but it’s not been confirmed by Bloomberg’s Economic Surprise Index of Leading Indicators, as you can see in the chart below.
Leading Indicator-Based Surprises Remain Negative
Source: Charles Schwab, Bloomberg, as of September 20, 2019.
As Cornerstone detailed, Citi’s index is comprised of a high number of “old news” (coincident-to-lagging) indicators—at least when it comes to financial markets:
- Change in non-farm payrolls
- Unemployment rate (one of the most lagging of all economic indicators)
- Trade balance
- GDP
- Retail sales ex-autos
- TICS net portfolio flows
- Durable goods orders
- Core CPI
- Industrial production
As you can see in the chart above, these two surprise indexes have diverged recently. This also occurred in 2015, although to a lesser degree. We know from the benefit of hindsight that the signal in 2015 from Citi’s was pre-maturely bullish. Again in 2017 the two diverged; yet this time Citi’s was way too bearish. Today it looks like Citi’s may be painting too optimistic a picture of the expected trajectory of the economy given that Bloomberg’s leading index has not confirmed Citi’s strength.
Tidbit
Cornerstone concluded their report by noting the temperature at JFK airport does a good job telling us where the Citigroup Global Economic Surprise Index is headed over the next six months. Why? Perhaps because Citi uses a three-month rolling window when measuring “surprises.” This make it, in most cases, a very “mean reverting” series. In other words, for the index to continue rising/falling, it has to beat/miss data at an accelerating pace; which rarely happens. Three months is a season in New York’s four-season climate. Correlation isn’t always causation!
In sum
A broad look at leading indicators suggests the economic expansion continues in 2019; but the pace of growth is likely to be no better than moderate. For now, the dividing line between the beleaguered manufacturing sector and the healthier services/consumer sector remains firm; while any denting of that line would likely be through the employment and/or confidence channels.
Important Disclosures:
The information provided here is for general informational purposes only and should not be considered an individualized recommendation or personalized investment advice. The investment strategies mentioned here may not be suitable for everyone. Each investor needs to review an investment strategy for his or her own particular situation before making any investment decision.
All expressions of opinion are subject to change without notice in reaction to shifting market conditions. Data contained herein from third-party providers is obtained from what are considered reliable sources. However, its accuracy, completeness or reliability cannot be guaranteed.
Examples provided are for illustrative purposes only and not intended to be reflective of results you can expect to achieve.
©2019 Charles Schwab & Co., Inc. All rights reserved. Member SIPC.
© Charles Schwab
More Factor-Based Investing Topics >