Chief Economist Eugenio J. Alemán discusses current economic conditions.
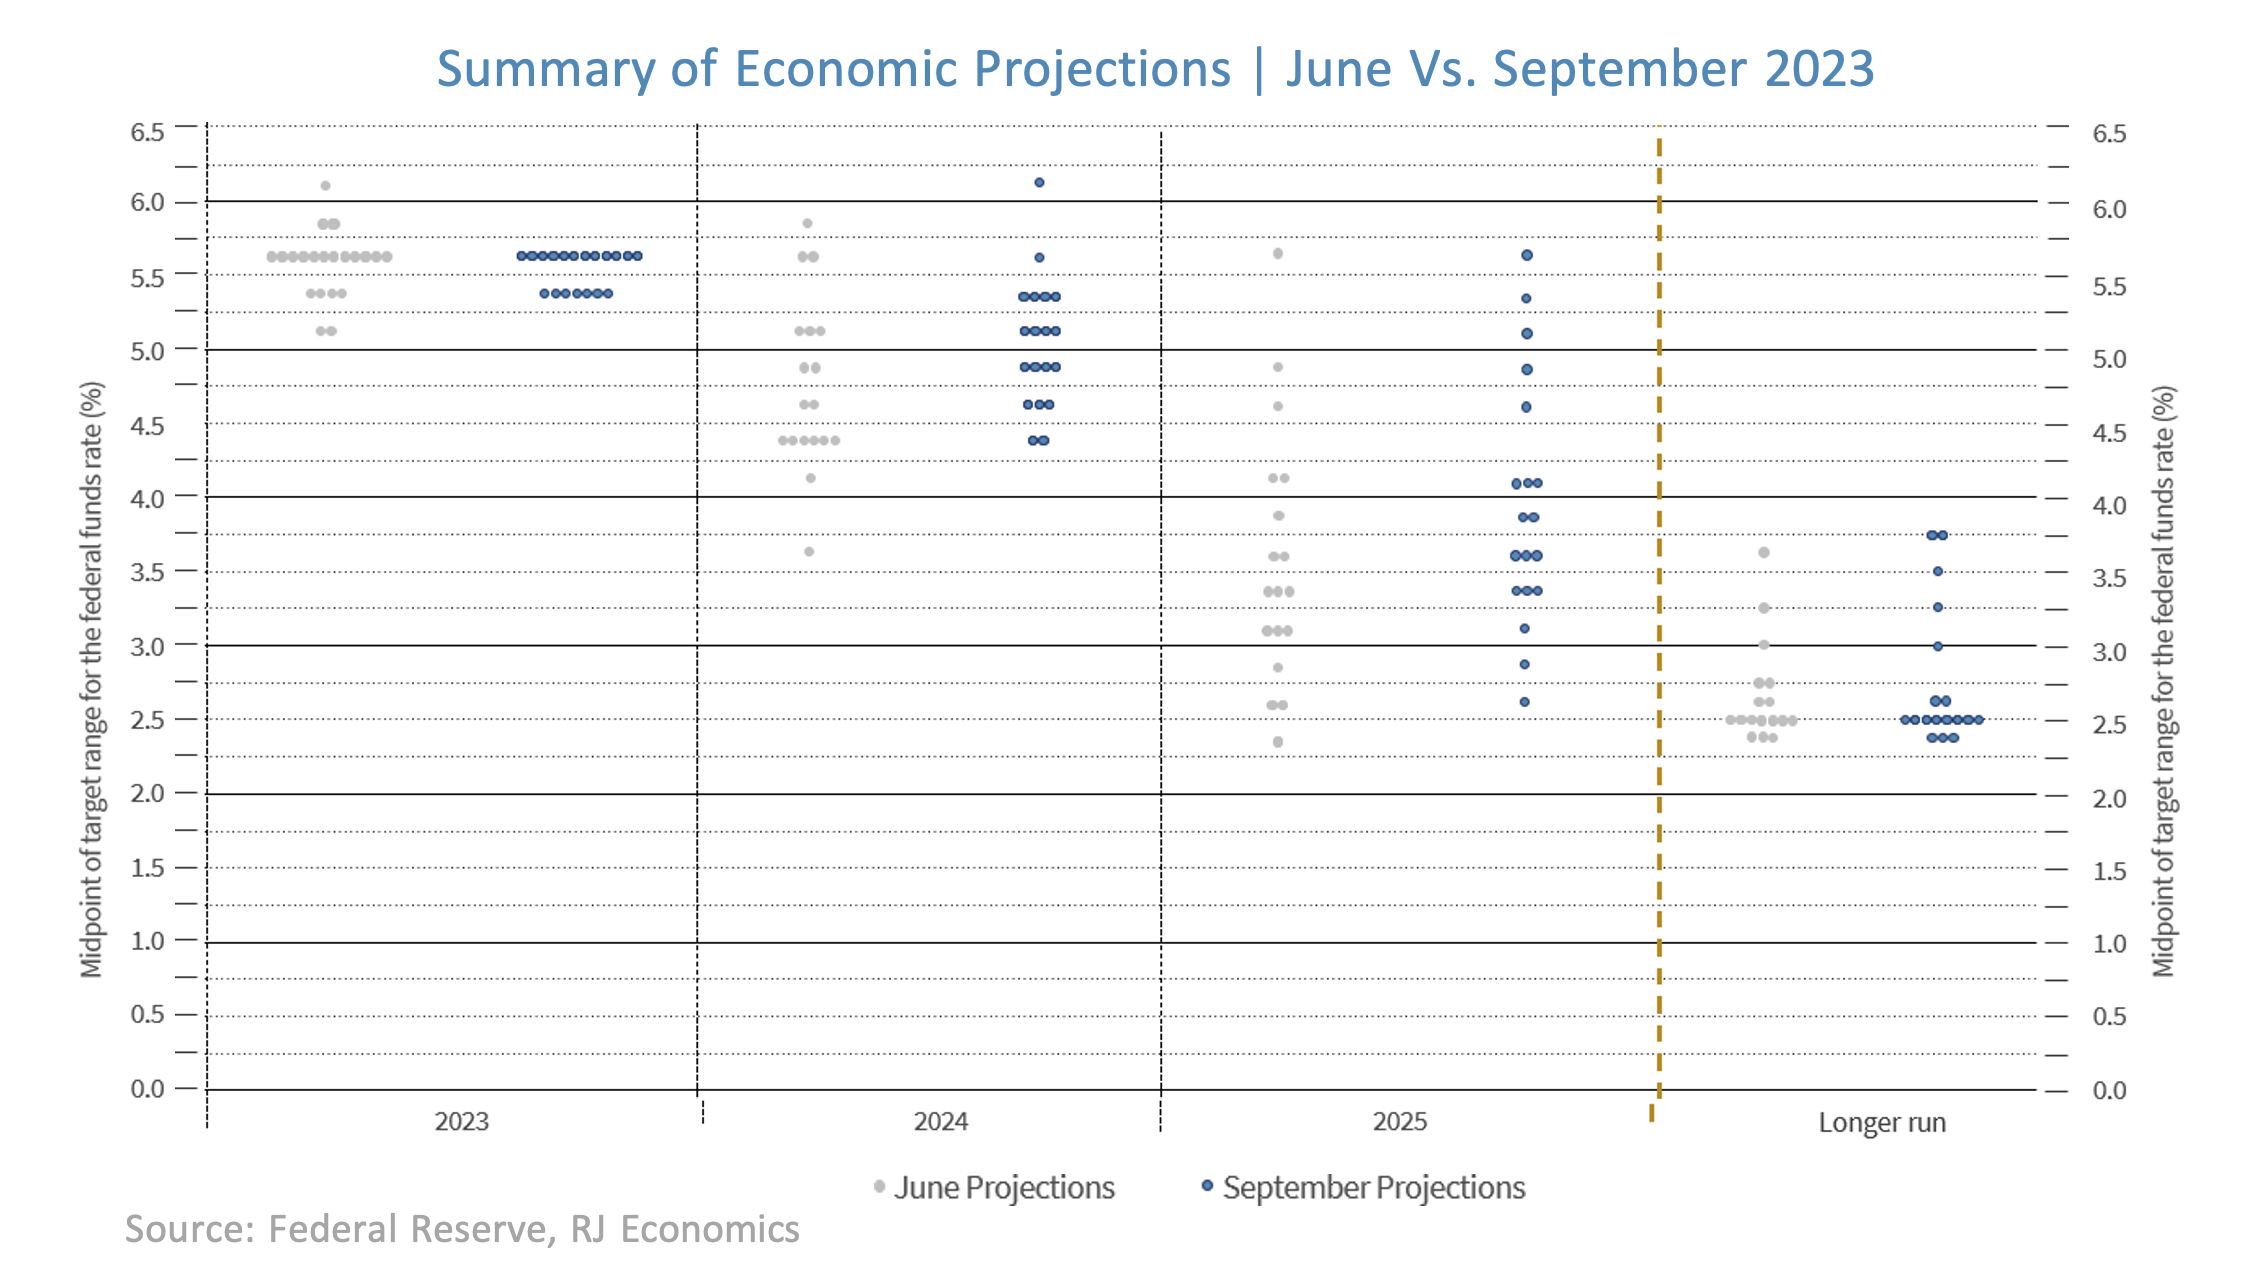
Wednesday’s Federal Reserve (Fed) decision to keep the federal funds rate unchanged wasn’t a surprise at all. Markets, as we argued last week, had predicted that the Fed was going to stay put and that is what it did. Coming out of the Federal Open Market Committee (FOMC) meeting, it kept another rate hike alive before the end of this year. It seems that markets are already second-guessing the Fed’s commitment as the betting markets are expecting, so far, that the Fed is going keep the pause for the rest of the year. If markets end up being correct, this will mean that 5.25%-5.50% is the end-of-cycle rate for this tightening cycle. The new dot plot shows that Fed officials are committed to keeping rates higher for longer, as they have been claiming for the last year or so. However, they now added some more ‘supporting evidence’ in the form of a better forecast for economic growth next year. But that was not everything, they supported their commitment to ‘higher for longer’ by eliminating two 25 basis points decreases next year compared to what the dot plot showed in June. This is a bold move, a move that will probably keep, once again, the markets second-guessing Fed members' intentions for, at least, the first half of next year.
The Fed’s implied explanation for this change is that it no longer sees a recession next year or, similarly, that it now seems to expect a ‘soft landing’ of the economy. Thus, the guidance it is trying to convey to the markets is that since it no longer sees a recession, markets should not expect interest rates to come down any time soon. Furthermore, if and when the Fed starts lowering interest rates, it will be at a ‘snails pace.’ This is probably the Fed’s way of saying that it wants interest rates to remain higher for longer. This one is, clearly, a tough pill to swallow for markets as they have become so used to expecting low interest rates.

In the graph above, we have plotted the federal funds rate and overall real investment at the top and then below we split real investment into real residential investment and real nonresidential investment. Also, recall that nonresidential investment is about two-thirds of total real investment spending while residential investment is the remaining one-third. The graph shows the strong negative effects of higher interest rates on real residential investment but almost no effects on nonresidential investment. Furthermore, as the graph clearly shows, today’s scenario is eerily similar to what happened back in 1994-1995 when the Fed engineered what some call a ‘soft landing.’
Perhaps the biggest question is what was happening to inflation at that time and what is happening to inflation today. In the 1994-1995 period, year-over-year the PCE price index as well as the PCE price index excluding food and energy were declining, i.e., disinflating, and very close to the 2.0% target. However, today, these two indices are also disinflating but are still very far away from the 2.0% Fed target (see graph below). Of course, if Fed officials believe that they have done enough to keep the disinflationary process going, then they may change their minds and not increase rates again. If this is the case, they may even be able to engineer another ‘soft landing’ as they did back in the mid-1990s. However, if Fed officials believe that the risks for inflation remain high, they may be willing to increase interest rates again. As it stands today, we still believe that the Fed is going to hike once more before the end of this year.
We will update our forecast for the federal funds rate once Fed officials release the Summary of Economic Projections, which will include the new ‘dot plot,’ after the September meeting of the Federal Open Market Committee meeting scheduled for September 19-20.
The Fed’s Revenge: Keep The Uncertainty Going
This week’s decision by the Fed did not help markets in any important ways. In fact, it added more uncertainty to an already uncertain future for rates as well as for the U.S. economy. The Fed’s interest rate decision, the Summary of Economic Projections (SEP), and the new dot plot were supposed to lower uncertainty. However, the opposite has been true. While markets hate uncertainty, the Fed seems to relish it. The biggest problem with this mismatch in objectives is that it will keep the markets second-guessing every move by the Fed going forward, which will actually keep the future even more uncertain.
We think we know why the Fed does this: because it doesn’t want markets to start in pricing lower rates any time soon. But this strategy is risky as we have been able to see with the surge in yields across the different maturities and the impact these higher rates are going to have on the US housing market as well as the potential to, in due time, affect other sectors of the economy.
Something Has Got to Give: Yields, the Leading Economic Indicators, Employment, Growth?
We are not so sure that the Fed was actually expecting such a strong upward move in yields. If it was clear that it did not like the decline in yields that occurred during the first quarter of the year, we are not so sure that it was expecting such a strong reaction from yields after this latest decision. Thus, we will have to wait and see what the economic effects of such high yields will be going forward and if these higher yields are going to threaten its soft landing prediction.
But for now, one of the most trusted economic indicators (or at least that was the case pre-COVID- pandemic) continued to point to an approaching recession for the US economy. The Conference Board’s Leading Economic Index declined once again in August, and “has now fallen for nearly a year and a half, indicating the economy is heading into a challenging growth period and possible recession over the new year,” according to Justyna Zabinska-La Monica, Senior Manager, Business Cycle Indicators, at the Conference Board.
However, other indicators are showing an economy that is growing very fast. This is the case of the Atlanta Fed GDPNow estimate for the third quarter of the year, which is currently predicting a growth rate of almost 5%. At the same time, initial jobless claims hit the lowest level during the week of September 16 since January 27, 2023, when they fell slightly below 200,000. However, nonfarm employment growth has been revised much lower than the original estimation, which tends to give some credence to a slowing in the labor market going forward.
Meanwhile, the inventory of homes for sale has remained extremely low in the existing home sales market as well as in the new home sales market, but for very different reasons. However, lower inventories mean that home prices have started to increase again, or at least they are not falling as much as should have been expected given the strong increase in mortgage rates. At the same time, with mortgage rates north of 7% and rising, it will add to affordability issues for those wanting to buy a home.
Thus, if yields remain at current levels, we should see some more weakening coming from the residential investment sector. However, it is still not clear if the non-residential investment market is going to be affected as much as the residential investment market, as the sector is still enjoying the tailwinds provided by the three government bills passed over the last several years, the CHIPS Act, the IRA, and the Infrastructure Bill.
What we do know is that uncertainty is here to stay no matter how much markets push for more certainty from the Fed. In summary, certainty will be the collateral damage as a result of the match between the Fed and the Markets!
Economic Releases:
NAHB/WF Housing Market Index: The recovery seen during the first half of the year in the National Association of Home Builders Index continues to fizzle as interest rates have moved above 7%, according to the NAHB. FactSet expectations were for a flat reading, at 50 in September but the Index dropped below the 50-demarcation point and into contraction at 45. Every component of the Index was lower in September than in August. The regional picture was also very weak, according to the report. It is clear that the recent increase in mortgage rates are having a negative impact on new home builders across the US. The NAHB/Wells Fargo National Housing Market Index (HMI) declined below the 50 demarcation point between expansion and contraction, to 45, the first time it has dropped below that level since May of this year, according to the National Association of Home Builders. All of the components of the Index declined compared to the August reading with the Single-Family Sales: Present Index coming down to 51 in September compared to a reading of 57 in August. Meanwhile, the Single Family Sales: Next 6 Months Index dropped below the 50-demarcation point, at 49 in September compared to a reading of 55 in August. Lastly, the Traffic of Prospective Buyers Index dropped further into contraction, from a reading of 35 in August to a reading of 30 in September. The Regional HMI also showed all regions in contraction territory with the Northeast HMI dropping from 55 in August to 48 in September while the Midwest HMI declining from 42 in August to 38 in September. The South HMI declined from 55 in August to 49 in September while the West HMI declined from 46 in August to 42 in September. This was the first time in five months that the NAHB Housing Market Index declined below the 50 demarcation point as “persistently high mortgage rates above 7% continue to erode builder confidence,” according to the NAHB release.
Housing Starts & Building Permits: The report on housing starts and building permits in August was mixed, with permits increasing while starts declined. Over the last several months, housing permits have stabilized while starts have weakened. Nevertheless, permits seem to point to continued expansion in this sector of the housing market. However, high mortgage rates could continue to affect housing starts going forward. Building permits increased by 6.9% in August compared to the previous month, to 1.543 million, according to the US Census Bureau and the US Department of Housing and Urban Development. FactSet consensus was for building permits of 1.440 million. Building permits were 2.7% lower than in August of 2022. Building permits were up in every region of the country: up 9.3% in the Northeast, up 14.3% in the Midwest, up 3.9% in the South, and 9.4% up in the West. However, all the regions recorded a decline compared to the same month the previous year. Housing starts were at an annual rate of 1.283 million or 11.3% lower than the July revised estimate of 1.447 million and 14.8% lower than the level in August of last year. In regional terms, housing starts were up by 1.0% in the Northeast but down 7.5% in the Midwest and also down 4.9% in the South. The West saw the largest decline in August compared to July of this year, plunging by 28.9%. All regions saw housing starts decline compared to a year earlier. Permits were up in August, but housing starts were down. However, permits seem to have stabilized while starts have been trending slightly downward.
Jobless Claims: Initial jobless claims continued to move lower on a weekly basis as well on a four-week moving average basis, indicating that the US labor market continues to outperform expectations. Seasonally adjusted initial claims declined to 201,000 from an upwardly revised level of 221,000 during the week ending September 16, according to the US Department of Labor. The four-week moving average stood at 217,000, a decline of 7,750 compared to the previous four-week moving average. Continuing claims dropped from 1.683 million during the week of September 2, 2023 to 1.662 million on September 9, 2023. The advance seasonally adjusted insured unemployment rate was 1.1%, unchanged from the rate recorded during the week ending September 9, 2023. Only one state reported an increase in unadjusted initial claims of more than 1,000 for the week ended September 9, 2023. These states were Ohio (3,425), Missouri (3,196), New York (3,051), California (1,880), Texas (1,393), and Hawaii (1,094).
Leading Economic Index: The Conference Board’s Leading Economic Index continues to point to an oncoming recession in the US. The Board also notes that some of the indicators, like new orders and consumer expectations, continue to weaken due to tight credit conditions and high interest rates. The Conference Board Leading Economic Index (LEI) declined by 0.4% in August, to 105.4, after declining by 0.3% in July, according to The Conference Board. The LEI was down 3.8% during the six-month period between February and August 2023. According to the release from The Conference Board, “With August’s decline, the US Leading Economic Index has now fallen for nearly a year and a half straight, indicating the economy is heading into a challenging growth period and possible recession over the next year.” The Conference Board Coincident Economic Index (CEI) was up by 0.2% in August to 110.6 after a 0.3% increase in July. The release indicated that “the CEI is now up 0.8% over the six-month period between February and August 2023.” The Conference Board Lagging Economic Index (LAG) also increased 0.2% in August of this year, to 118.5. The Conference Board LEI has been pointing to a US economic recession since the middle of last year. We continue to believe that, as economic activity weakens over the next quarters, the US economy will enter a mild recession.
Existing Home Sales: Existing home sales continued to come down in August and were lower than expected during the month. However, as it is normally the case, the regional picture was mixed, with some regions seeing increases and others remaining flat or declining. According to the Chief Economist of the National Association of Realtors, “home prices continue to march higher despite lower home sales,” adding that “supply needs to essentially double to moderate home price gains.” Existing home sales declined 0.7% during the month of August of 2023 compared to July of this year to a seasonally adjusted annual rate of
4.04 million, according to the National Association of Realtors (NAR). FactSet expected existing-home sales at 4.10 million during the month. Compared to August of last year, existing home sales were down 15.3%. In regional terms, the picture was mixed versus July of this year, but all showed a decline over the same month a year earlier. In the Northeast region sales were flat in August compared to July but down 22.6% versus a year earlier, while the Midwest saw an increase of 1.0% versus July but down 16.4% versus a year earlier. The South saw existing home sales decline 1.1% versus July of this year and down by 12.4% versus August of last year. Meanwhile, the West saw the largest month-over-month decline, down 2.6%, while they were down 15.7% compared to August of last year. The number of months in inventory remained at 3.3 months, but the level of inventories was down from 1.11 million in July to 1.10 million in August. The median price of existing homes increased slightly, from $405,700 in July to $407,100 in August of this year and 3.9% higher than the median recorded in August of last year of $391,700. Existing-home sales continued to trend down in August while the inventory of homes declined in August compared to July. However, the number of months in supply remained unchanged.
Economic and market conditions are subject to change.
Opinions are those of Investment Strategy and not necessarily those of Raymond James and are subject to change without notice. The information has been obtained from sources considered to be reliable, but we do not guarantee that the foregoing material is accurate or complete. There is no assurance any of the trends mentioned will continue or forecasts will occur. Last performance may not be indicative of future results.
Consumer Price Index is a measure of inflation compiled by the US Bureau of Labor Statistics. Currencies investing is generally considered speculative because of the significant potential for investment loss. Their markets are likely to be volatile and there may be sharp price fluctuations even during periods when prices overall are rising.
Consumer Sentiment is a consumer confidence index published monthly by the University of Michigan. The index is normalized to have a value of 100 in the first quarter of 1966. Each month at least 500 telephone interviews are conducted of a contiguous United States sample.
Personal Consumption Expenditures Price Index (PCE): The PCE is a measure of the prices that people living in the United States, or those buying on their behalf, pay for goods and services. The change in the PCE price index is known for capturing inflation (or deflation) across a wide range of consumer expenses and reflecting changes in consumer behavior.
The Consumer Confidence Index (CCI) is a survey, administered by The Conference Board, that measures how optimistic or pessimistic consumers are regarding their expected financial situation. A value above 100 signals a boost in the consumers’ confidence towards the future economic situation, as a consequence of which they are less prone to save, and more inclined to consume. The opposite applies to values under 100.
Certified Financial Planner Board of Standards Inc. owns the certification marks CFP®, CERTIFIED FINANCIAL PLANNER™, CFP® (with plaque design) and CFP® (with flame design) in the U.S., which it awards to individuals who successfully complete CFP Board's initial and ongoing certification requirements.
Links are being provided for information purposes only. Raymond James is not affiliated with and does not endorse, authorize or sponsor any of the listed websites or their respective sponsors. Raymond James is not responsible for the content of any website or the collection or use of information regarding any website's users and/or members.
GDP Price Index: A measure of inflation in the prices of goods and services produced in the United States. The gross domestic product price index includes the prices of U.S. goods and services exported to other countries. The prices that Americans pay for imports aren't part of this index.
The Conference Board Leading Economic Index: Intended to forecast future economic activity, it is calculated from the values of ten key variables.
The Conference Board Coincident Economic Index: An index published by the Conference Board that provides a broad-based measurement of current economic conditions.
The Conference Board lagging Economic Index: an index published monthly by the Conference Board, used to confirm and assess the direction of the economy's movements over recent months.
The U.S. Dollar Index is an index of the value of the United States dollar relative to a basket of foreign currencies, often referred to as a basket of U.S. trade partners' currencies. The Index goes up when the U.S. dollar gains "strength" when compared to other currencies.
The FHFA House Price Index (FHFA HPI®) is a comprehensive collection of public, freely available house price indexes that measure changes in single-family home values based on data from all 50 states and over 400 American cities that extend back to the mid-1970s.
Import Price Index: The import price index measure price changes in goods or services purchased from abroad by U.S. residents (imports) and sold to foreign buyers (exports). The indexes are updated once a month by the Bureau of Labor Statistics (BLS) International Price Program (IPP).
ISM New Orders Index: ISM New Order Index shows the number of new orders from customers of manufacturing firms reported by survey respondents compared to the previous month. ISM Employment Index: The ISM Manufacturing Employment Index is a component of the Manufacturing Purchasing Managers Index and reflects employment changes from industrial companies.
ISM Inventories Index: The ISM manufacturing index is a composite index that gives equal weighting to new orders, production, employment, supplier deliveries, and inventories.
ISM Production Index: The ISM manufacturing index or PMI measures the change in production levels across the U.S. economy from month to month.
ISM Services PMI Index: The Institute of Supply Management (ISM) Non-Manufacturing Purchasing Managers' Index (PMI) (also known as the ISM Services PMI) report on Business, a composite index is calculated as an indicator of the overall economic condition for the non-manufacturing sector.
Consumer Price Index (CPI) A consumer price index is a price index, the price of a weighted average market basket of consumer goods and services purchased by households. Changes in measured CPI track changes in prices over time.
Producer Price Index: A producer price index (PPI) is a price index that measures the average changes in prices received by domestic producers for their output.
Industrial production: Industrial production is a measure of output of the industrial sector of the economy. The industrial sector includes manufacturing, mining, and utilities. Although these sectors contribute only a small portion of gross domestic product, they are highly sensitive to interest rates and consumer demand.
The NAHB/Wells Fargo Housing Opportunity Index (HOI) for a given area is defined as the share of homes sold in that area that would have been affordable to a family earning the local median income, based on standard mortgage underwriting criteria.
The S&P CoreLogic Case-Shiller U.S. National Home Price NSA Index measures the change in the value of the U.S. residential housing market by tracking the purchase prices of single-family homes.
The S&P CoreLogic Case-Shiller 20-City Composite Home Price NSA Index seeks to measures the value of residential real estate in 20 major U.S. metropolitan.
Source: FactSet, data as of 7/7/2023
A message from Advisor Perspectives and VettaFi: To learn more about this and other topics, check out our most recent white papers.
© Raymond James
Read more commentaries by Raymond James