Municipal Bonds: Fiscal 2026 State Outlook
Membership required
Membership is now required to use this feature. To learn more:
View Membership Benefits
Revenues Perform Well; Reserves Remain Robust
The U.S. economy has thus far avoided recession, yet growth has decelerated and economic risks persist. Tax revenues have remained strong, and most states either met or exceeded revenue targets for fiscal 2025, with revenues estimated upward at 3%. States project just under 3% revenue growth for fiscal 2026 on average, which we see as realistic. While this is far slower than the extraordinary gains of 17% and 16% in fiscal 2021 and 2022, it aligns closely with trends observed during the previous decade. This slower revenue growth has led states to rein in spending plans for fiscal 2026, which began on July 1 in most states.
The two main sources of state tax revenues are income and sales taxes. Sales tax growth is tepid but steady, boosted by inflation, which is still tracking ahead of pre-pandemic norms. Income tax has provided more growth, with recent estimates from the National Association of State Budget Officers (NASBO) showing 6.7% growth for fiscal 2025 and a projection of just under 5% for fiscal 2026. New York’s progressive income tax, which is sensitive to capital gains, posted 14% growth for the fiscal year ending March 31 and is up another 16% through the first four months of fiscal 2026.
States have generally kept tax regimes stable in recent years. NASBO reported that during the fiscal 2026 budget cycle, governors proposed just $6.6 billion in tax cuts and $6 billion in tax increases. Several southern states, Louisiana and Mississippi, for example, are reducing income tax rates in favor of sales taxes in recent years. We view this as credit neutral, as long as states maintain structural budget balance during this process.
EXHIBIT 1: OUTLOOKS ANCHORED NEAR STABLE WHILE RESILIENCY IS STRONG
Outlooks for higher education and healthcare are the weakest while transportation and essential utilities are the strongest. Resiliency to withstand an economic downturn is strong for all sectors.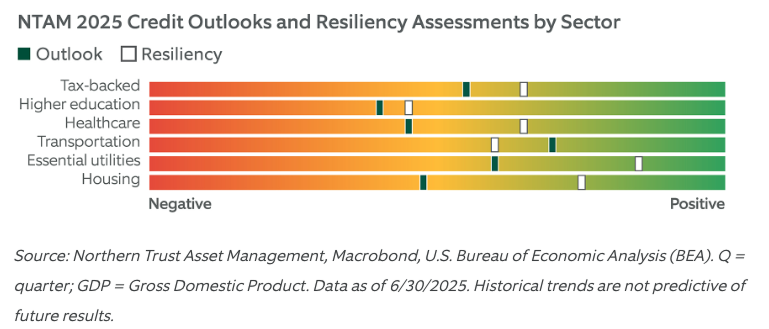
Following the Global Financial Crisis, states of all political stripes focused on building rainy day reserves, which grew gradually during the 2010s, then more than doubled due to significant revenue outperformance in fiscal 2021 and 2022. Rainy day funds peaked in fiscal 2023 and are estimated to finish fiscal 2025 at $164 billion—13% of annual general fund spending and more than 2.5 times the level of 2007. Most states budgeted to maintain or increase reserves in fiscal 2026, preserving a healthy margin of safety for underperforming revenues or unexpected expenses. Even chronically under-reserved states like Illinois have seen improvements. The Land of Lincoln closed fiscal 2025 with nearly $2.4 billion (4% of annual spending) in its rainy day fund, compared to zero before the pandemic. This has earned the state three rounds of credit upgrades and tighter credit spreads, although it remains the weakest state credit.
EXHIBIT 2: REVENUE VOLATILITY SUBSIDES
Growth in tax revenue returned to trend in 2024 and we expect positive growth in 2025.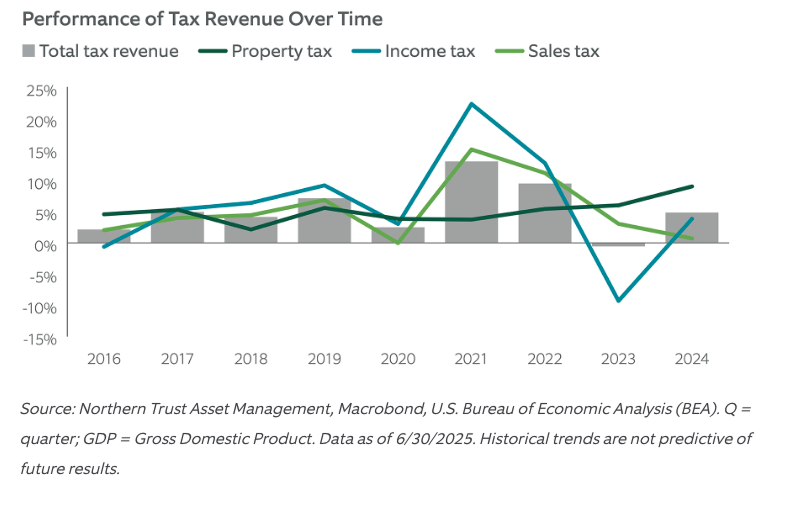
Understanding State Resiliency
Even well-managed states experience financial volatility. Recessions hit state budgets from both sides: tax revenues decline while demand for safety net programs rises. Unexpected events, such as natural disasters, terrorist attacks, civil unrest, or pandemics, can radically alter state budget forecasts. States have fiscal tools to manage these events, including raising new revenues, reducing or delaying spending, refinancing debt, borrowing, or using reserves. These sovereign powers are a key reason we favor state bonds.
On a relative basis, state resiliency varies. Key factors in evaluating state resiliency include:
- Reserves: Reserves increase fiscal safety margins. Reserve accumulation is particularly important for states with volatile revenue structures—for example, California, with a heavy dependence on capital gains, and Alaska, with dependence on oil revenues.
- Fixed Costs: Legacy costs like pensions, retiree health, and debt service reduce budgeting flexibility. Light debt issuance and strong pension returns have eased fixed costs in recent years, although some states still face a heavy burden. New Jersey’s annual retirement costs, for example, are elevated with combined retirement contributions equaling more than two times annual debt service payments. Increased funding and strong investment returns helped New Jersey’s combined-retirement, plan-funded ratios improve to 50% in 2024 from 47% in 2023.
- Management: We prefer states that budget conservatively and can adjust revenue forecasts quickly when conditions warrant. Rhode Island, for example, has a statutory requirement that limits spending to 97% of estimated revenue , allocating the remaining 3% to the rainy day fund. This is designed to promote fiscal discipline and buffer shortfalls.
EXHIBIT 3: OPERATING MARGINS DECLINE
As pandemic aid ran off, public college margins declined back to trend, but private colleges, particularly small ones, fell below pre-pandemic levels.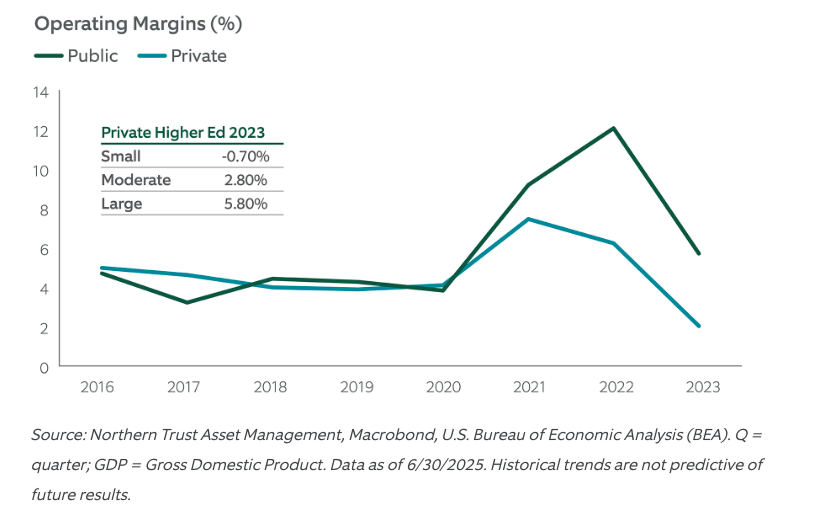
Healthcare: Policy Uncertainty
Outlook
The fundamentals of the not-for-profit (NFP) healthcare sector remain supportive, but the sector is entering a period of increased policy uncertainty. Fiscal 2024 has been a year of recovery for providers, continuing a dynamic that began in fiscal 2023.
COVID-era inflation and wage pressures have broadly reset the long-term cost basis for providers. However, ongoing recovery, normalizing labor markets, and a heightened focus on revenue cycle and expenses management signal a more constructive credit environment. The pace of recovery has been uneven across providers. Issuers who experienced more acute operating/financial pressure through the pandemic and/or had pre-existing challenges continue to lag in the transition to recovery.
Major policy disrupters reside at opposite ends of the political spectrum and are generally thought of as Medicare-for-All on the left and a Repeal-and-Replace of the ACA on the right. Each would have negative implications for provider reimbursement. The ACA has survived several trips to the U.S. Supreme Court over its 14-year period and congressional repeal efforts nearly succeeded during the first Trump Administration in 2017. The incoming administration has yet to unveil a Trump 2.0 healthcare agenda, and little clarity was provided on the campaign trail. However, President-elect Donald J. Trump has consistently emphasized the unaffordability of healthcare costs. The House Speaker has signaled that major changes are on the horizon, and Cabinet nominees suggest that federal spending cuts may be under consideration.
While the new Trump Administration may have moved away from its previous tagline for healthcare reform, we anticipate that any significant changes will likely resemble earlier proposals. Republican control of Congress adds to the overall uncertainty. We anticipate the immediate focus to center on allowing enhanced Medicaid subsidies to expire, renewing Medicaid work requirements, and/or establishing a block grant funding formula, and implementing supportive measures for drug price negotiations and Medicare Advantage programs. We do not expect an immediate financial impact to providers, as the effects are likely to unfold gradually over a longer period as adjustments are implemented. This would provide more nimble management teams the opportunity to minimize the impact of policy changes.
Resiliency
We continue to view the NFP healthcare sector as a resilient area of the municipal market. Providers have a long history of responding to policy changes and have broadly survived (with federal support) the stress of the COVID-19 pandemic. Credit stress does not equate to distress, making this sector a particularly attractive relative value opportunity for municipal investors. Sector returns have generally outperformed the broader municipal market over the past 10 years.
EXHIBIT 4: HOSPITAL RETURNS GENERALLY OUTPERFORM THE BROAD MARKET
The hospital sector has outperformed the broader municipal market in all but one of the last 10 years.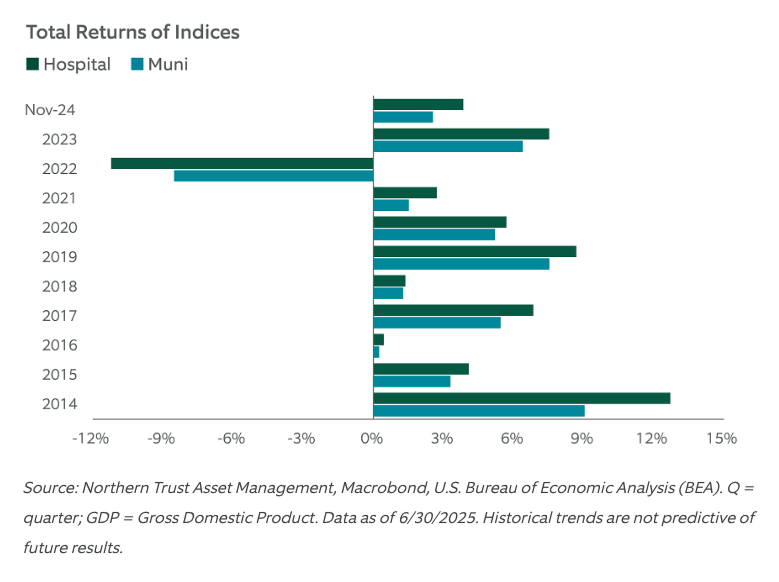
Transportation: Stable Outlook
Outlook
Our outlook for the transportation sector is stable for 2025. This is underpinned by our economic view of a soft landing. Economic growth and passenger traffic largely correlates and we expect travel volumes to track roughly in line with GDP growth in 2025 after the volatility of the past few years. Policy risks for transportation are muted compared to other sectors and the downside risks are more tied to economic growth. Toll roads have historically weathered downturns better than airports as driving miles are less sensitive to economic changes.
Airports and toll roads have benefited from improved financials, highlighted by a 30% increase in days cash on hand over the past five years, reaching near all-time highs alongside reduced leverage. Bond issuance has been depressed in recent years as COVID-related uncertainty deferred capital plans and federal stimulus addressed some needs. This is reflected by new money issuance down 9% for airports and down 19% for toll roads over the past five years compared to the previous five-year period. We expect bond issuance to increase in 2025 as capital plans expand with rising travel demand, stimulus funds are depleted, and inflation drives up project costs. We think airports and toll roads are well positioned to manage the increased debt given their improved financial position.
Ports could be pressured depending on the magnitude of tariffs implemented that could reduce imports. Mass transit ridership is growing but is unlikely to fully recover to pre-COVID levels in the near-term. Most mass transit systems rely on local funding sources such as sales taxes, which are tied to economic growth. These sources will be needed to offset declines in farebox revenues.
Resiliency
We believe the sector’s resiliency is solid, given the critical importance of transportation assets to the nation. Strong financial performance has boosted liquidity metrics to near all-time highs, which provides a buffer if the economy declines more than we expect. This cushion will protect credit quality as capital plans increase debt levels.
EXHIBIT 5: PASSENGER VOLUMES NORMALIZING
Road and airline travel have returned to pre-COVID levels and are expected to align with economic growth trends in 2025 while mass transit lags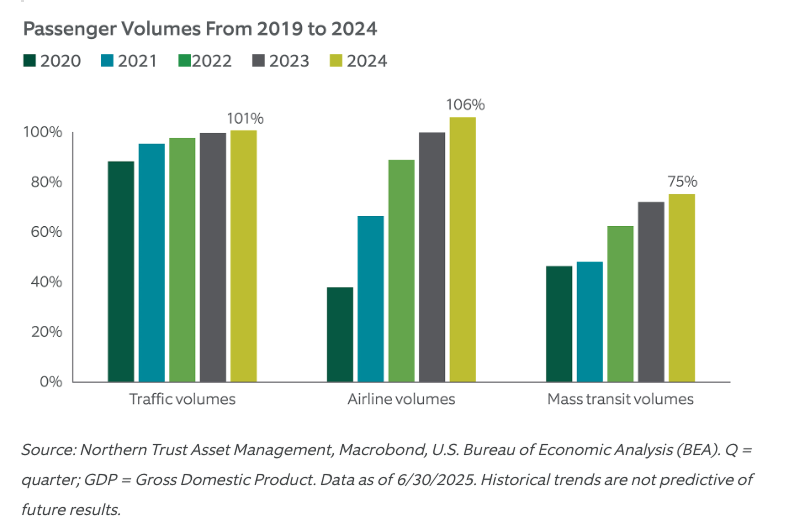
Essential Utilities: Stable and Highly Resilient
Outlook
Essential utilities remain well-positioned into 2025 with their monopolistic authority, growing demand for services, and continued federal funding supporting infrastructure investments. Operations remain strong with net revenues covering debt service by around two times on average with liquidity exceeding a year’s expenses. We anticipate financial performance to remain strong in 2025 given pricing power, although risks remain if inflation reignites or an economic downturn limits ability to increase rates. Cybersecurity remains a risk, although utilities continue to invest in dedicated technology teams and partner with state agencies for insurance and oversight.
We expect debt issuance to grow next year due to rising capital needs. Water/sewer entities face shortened deadlines to replace lead piping and reduce discharge of harmful chemicals, although the new federal administration may relax these requirements. Electric utilities face a continued focus on decarbonization and asset hardening to withstand more frequent extreme weather events. New artificial intelligence (AI) and data centers are increasing power demand, and so it is essential for utilities to build new facilities and utilize excess power capacity from current power plants.
Resiliency
We expect the sector’s resilience to remain strong, given its limited exposure to economic cyclicality, its status as a natural monopoly with rate setting authority, and its solid reserves to support operational costs and capital needs. The utility sector is also less vulnerable to federal policy changes than other sectors.
Housing: Steady and Resilient
Outlook
State Housing Finance Agencies (HFAs) sell bonds to finance subsidized mortgages to targeted populations and to promote home ownership. HFA credit quality is expected to remain steady and strong in 2025. Median margins have eased from nearly 20% in 2023 to the likely 16 to 18% range in 2025 as interest rates fall, but they remain healthy and have ample cushion. High demand for affordable housing continues to benefit HFAs and we expect strong supply trends for 2025 given HFAs competitive advantage in rates to conventional lenders.
Resiliency
Resiliency remains strong. Compared to previous eras, HFAs are better equipped with strong collateralization, an increased percentage of government-backed loans, and a reduced complexity of bond structures, which will help the sector to withstand a considerable level of housing market volatility. A significant amount of cash and investments held by agencies (median: nearly 50% of bonds outstanding) will provide healthy support during economic downturns.
A message from Advisor Perspectives and VettaFi: To learn more about this and other topics, check out some of our webcasts.
IMPORTANT INFORMATION
Northern Trust Asset Management (NTAM) is composed of Northern Trust Investments, Inc., Northern Trust Global Investments Limited, Northern Trust Fund Managers (Ireland) Limited, Northern Trust Global Investments Japan, K.K., NT Global Advisors, Inc., 50 South Capital Advisors, LLC, Northern Trust Asset Management Australia Pty Ltd, and investment personnel of The Northern Trust Company of Hong Kong Limited and The Northern Trust Company.
Issued in the United Kingdom by Northern Trust Global Investments Limited, issued in the European Economic Association (“EEA”) by Northern Trust Fund Managers (Ireland) Limited, issued in Australia by Northern Trust Asset Management (Australia) Limited (ACN 648 476 019) which holds an Australian Financial Services Licence (License Number: 529895) and is regulated by the Australian Securities and Investments Commission (ASIC), and issued in Hong Kong by The Northern Trust Company of Hong Kong Limited which is regulated by the Hong Kong Securities and Futures Commission.
For Asia-Pacific (APAC) and Europe, Middle East and Africa (EMEA) markets, this information is directed to institutional, professional and wholesale clients or investors only and should not be relied upon by retail clients or investors. This information may not be edited, altered, revised, paraphrased, or otherwise modified without the prior written permission of NTAM. The information is not intended for distribution or use by any person in any jurisdiction where such distribution would be contrary to local law or regulation. NTAM may have positions in and may effect transactions in the markets, contracts and related investments different than described in this information. This information is obtained from sources believed to be reliable, its accuracy and completeness are not guaranteed, and is subject to change. Information does not constitute a recommendation of any investment strategy, is not intended as investment advice and does not take into account all the circumstances of each investor.
This report is provided for informational purposes only and is not intended to be, and should not be construed as, an offer, solicitation or recommendation with respect to any transaction and should not be treated as legal advice, investment advice or tax advice. Recipients should not rely upon this information as a substitute for obtaining specific legal or tax advice from their own professional legal or tax advisors. References to specific securities and their issuers are for illustrative purposes only and are not intended and should not be interpreted as recommendations to purchase or sell such securities. Indices and trademarks are the property of their respective owners. Information is subject to change based on market or other conditions.
All securities investing and trading activities risk the loss of capital. Each portfolio is subject to substantial risks including market risks, strategy risks, advisor risk, and risks with respect to its investment in other structures. There can be no assurance that any portfolio investment objectives will be achieved, or that any investment will achieve profits or avoid incurring substantial losses. No investment strategy or risk management technique can guarantee returns or eliminate risk in any market environment. Risk controls and models do not promise any level of performance or guarantee against loss of principal. Any discussion of risk management is intended to describe NTAM’s efforts to monitor and manage risk but does not imply low risk.
Past performance is not a guarantee of future results. Performance returns and the principal value of an investment will fluctuate. Performance returns contained herein are subject to revision by NTAM. Comparative indices shown are provided as an indication of the performance of a particular segment of the capital markets and/or alternative strategies in general. Index performance returns do not reflect any management fees, transaction costs or expenses. It is not possible to invest directly in any index. Net performance returns are reduced by investment management fees and other expenses relating to the management of the account. Gross performance returns contained herein include reinvestment of dividends and other earnings, transaction costs, and all fees and expenses other than investment management fees, unless indicated otherwise. For U.S. NTI prospects or clients, please refer to Part 2a of the Form ADV or consult an NTI representative for additional information on fees.
Forward-looking statements and assumptions are NTAM’s current estimates or expectations of future events or future results based upon proprietary research and should not be construed as an estimate or promise of results that a portfolio may achieve. Actual results could differ materially from the results indicated by this information.
Membership required
Membership is now required to use this feature. To learn more:
View Membership BenefitsSponsored Content
Upcoming Virtual Events View All


