Energy Credit Market Returns Reflect Sector Discipline
Membership required
Membership is now required to use this feature. To learn more:
View Membership BenefitsKey takeaways
- Domestic trends drive U.S. market moves: Over the past week, U.S. markets looked through geopolitics and went back to the usual domestic drivers, including AI optimism, Federal Reserve expectations, and the May jobs report released Friday.
- The longer story behind energy credit: Energy credit outperformance is not primarily tied to the spike in oil prices; it reflects a more credit-friendly sector structure.
- Oil price regimes underpin energy sector sensitivity: When oil prices are above breakeven (that is, the minimum price to balance the total cost of production), then the oil price itself matters less for energy sector performance; below breakeven, energy credit becomes much more sensitive to changes in oil prices.
Read more: The Quiet Erosion Beneath U.S. Growth
Last week, despite seeing little tangible progress toward resolving the Iran conflict, U.S. markets quickly reverted to their familiar domestic anchors: AI capex optimism and the Federal Reserve outlook.
It was, on balance, a strong week for risk markets, helped by renewed enthusiasm around AI spending and IPO demand, until Friday’s post-payroll sell-off reminded investors that, in this market, good news can still be bad news. A stronger labor report prompted markets to reprice toward a more hawkish Fed hiking interest rates as early as this year.
This capped a week in which geopolitical tension mattered less than the usual mix of domestic micro and macro forces, particularly given already rich valuations in risk assets. The macro risks have not changed much: either a growth slowdown driven by a lingering energy supply shock, or an overheating economy that pushes inflation higher and puts upward pressure on both yields and risk assets.
Within credit markets, one sector that’s shown ongoing strength amid macro turbulence is energy.
Energy outperformance: More about credit discipline than higher oil prices
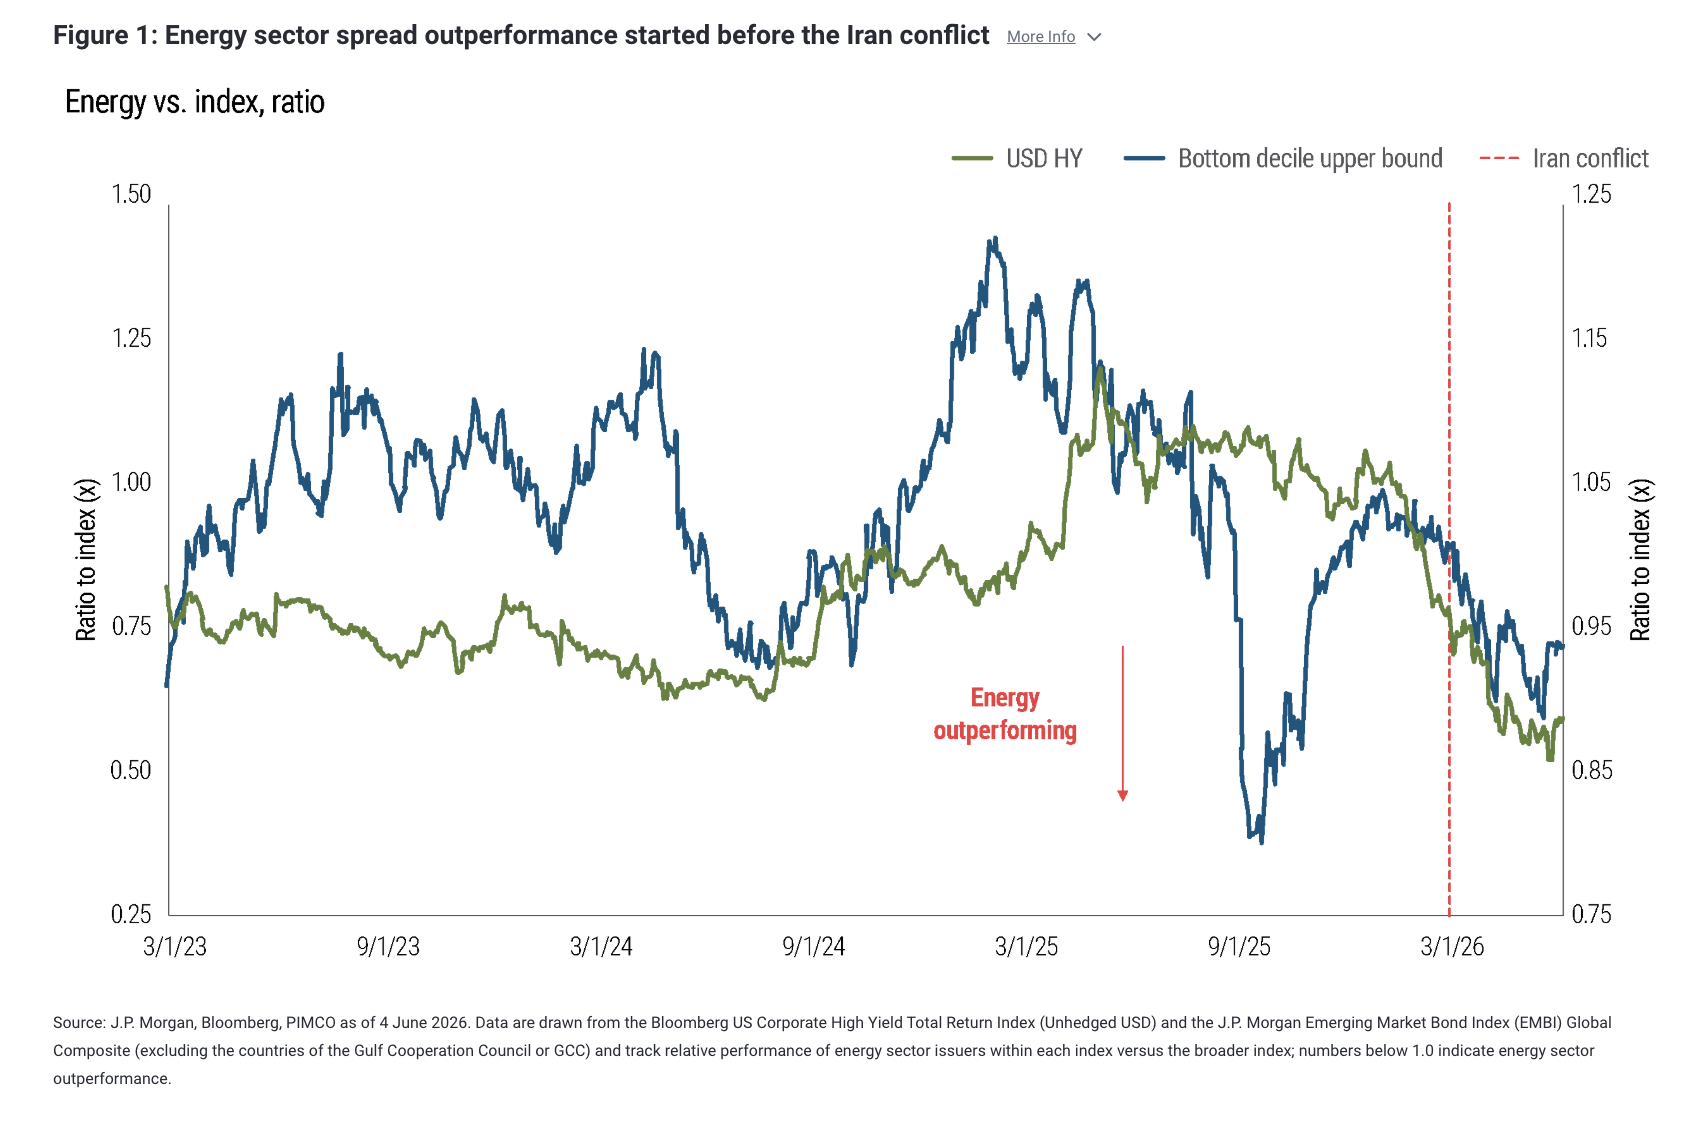
Higher prices have helped sustain spread tightening, especially in the USD HY Index. But the bigger driver, in our view, has been the sector’s shift toward a more disciplined, credit-friendly posture from a capital management standpoint, a trend that will likely persist. That shows up in three ways.
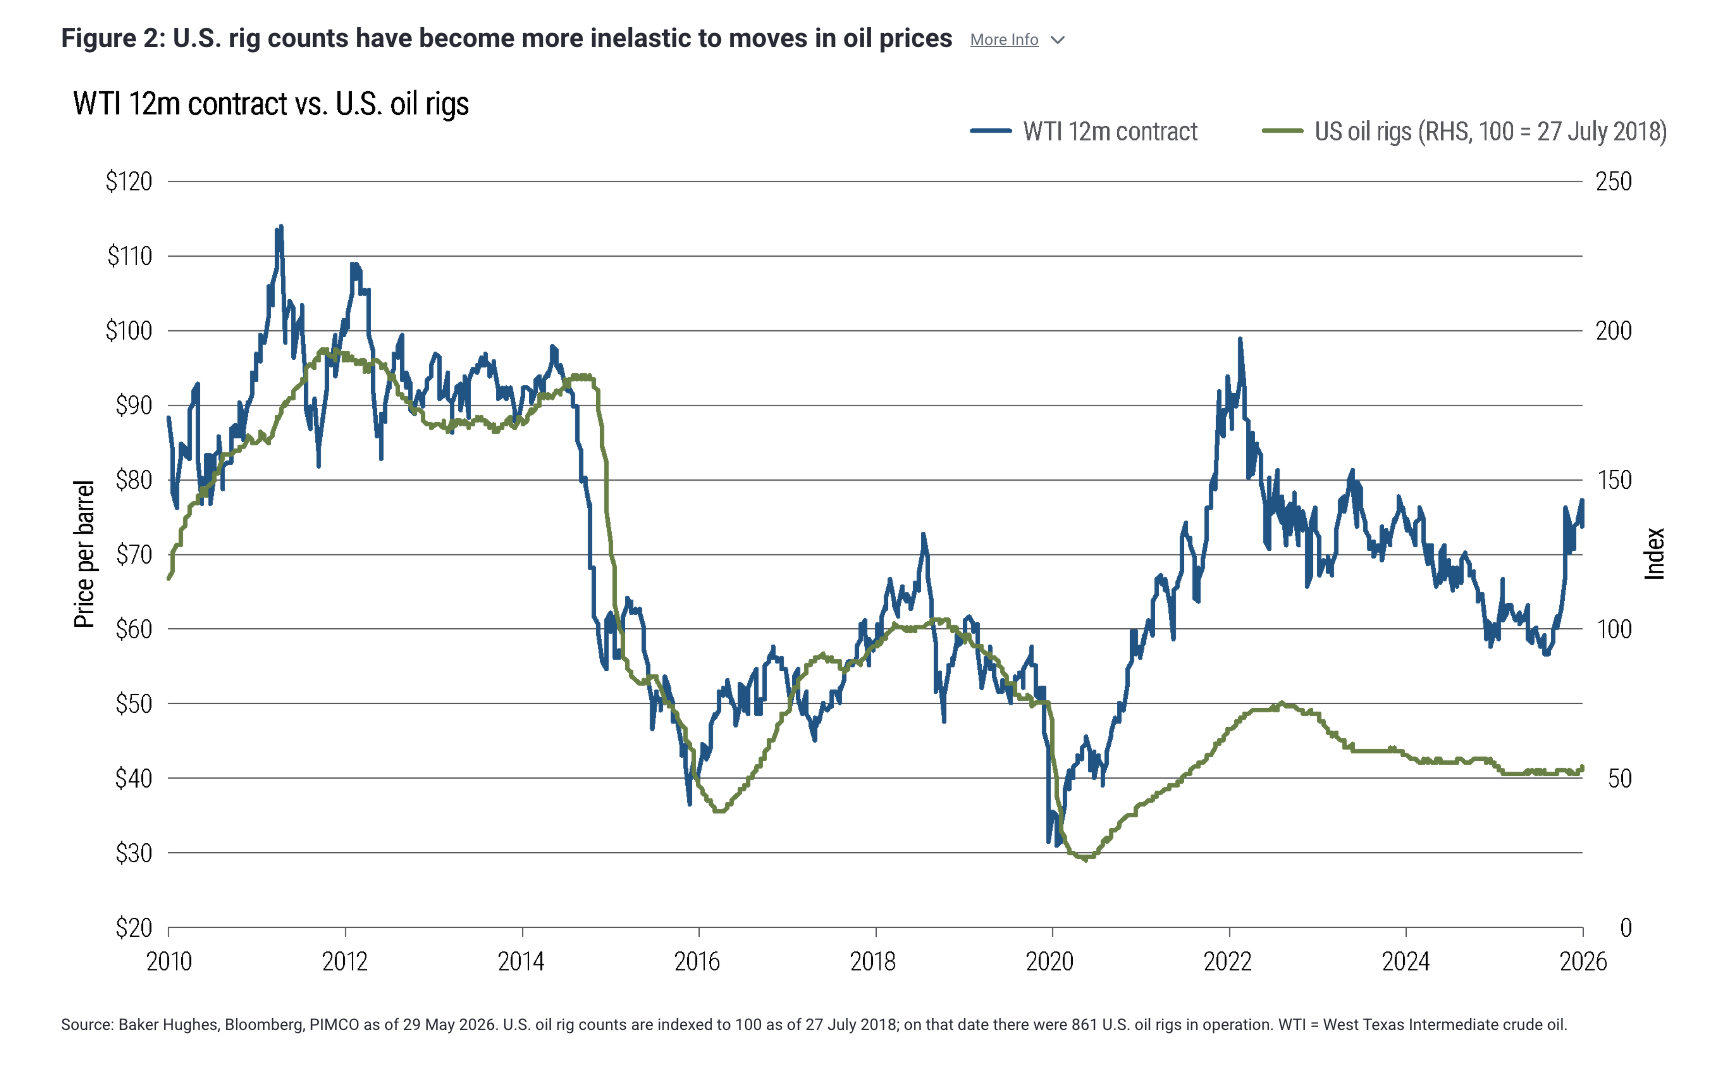
First, unlike in past periods of rising oil prices, U.S. oil rig counts have remained relatively inelastic. Figure 2 shows that since the post-COVID recovery and the 2022 energy price spike, the number of operating U.S. oil rigs has been broadly stable despite large swings in oil prices. That is a sharp contrast with the pre-2020 period, when the relationship was much tighter, and even more so relative to the pre-2015 “wildcatting” phase of the shale revolution. Some of this reflects better operational efficiency, but absent a prolonged period of elevated prices, near-term growth in rig counts still looks unlikely.
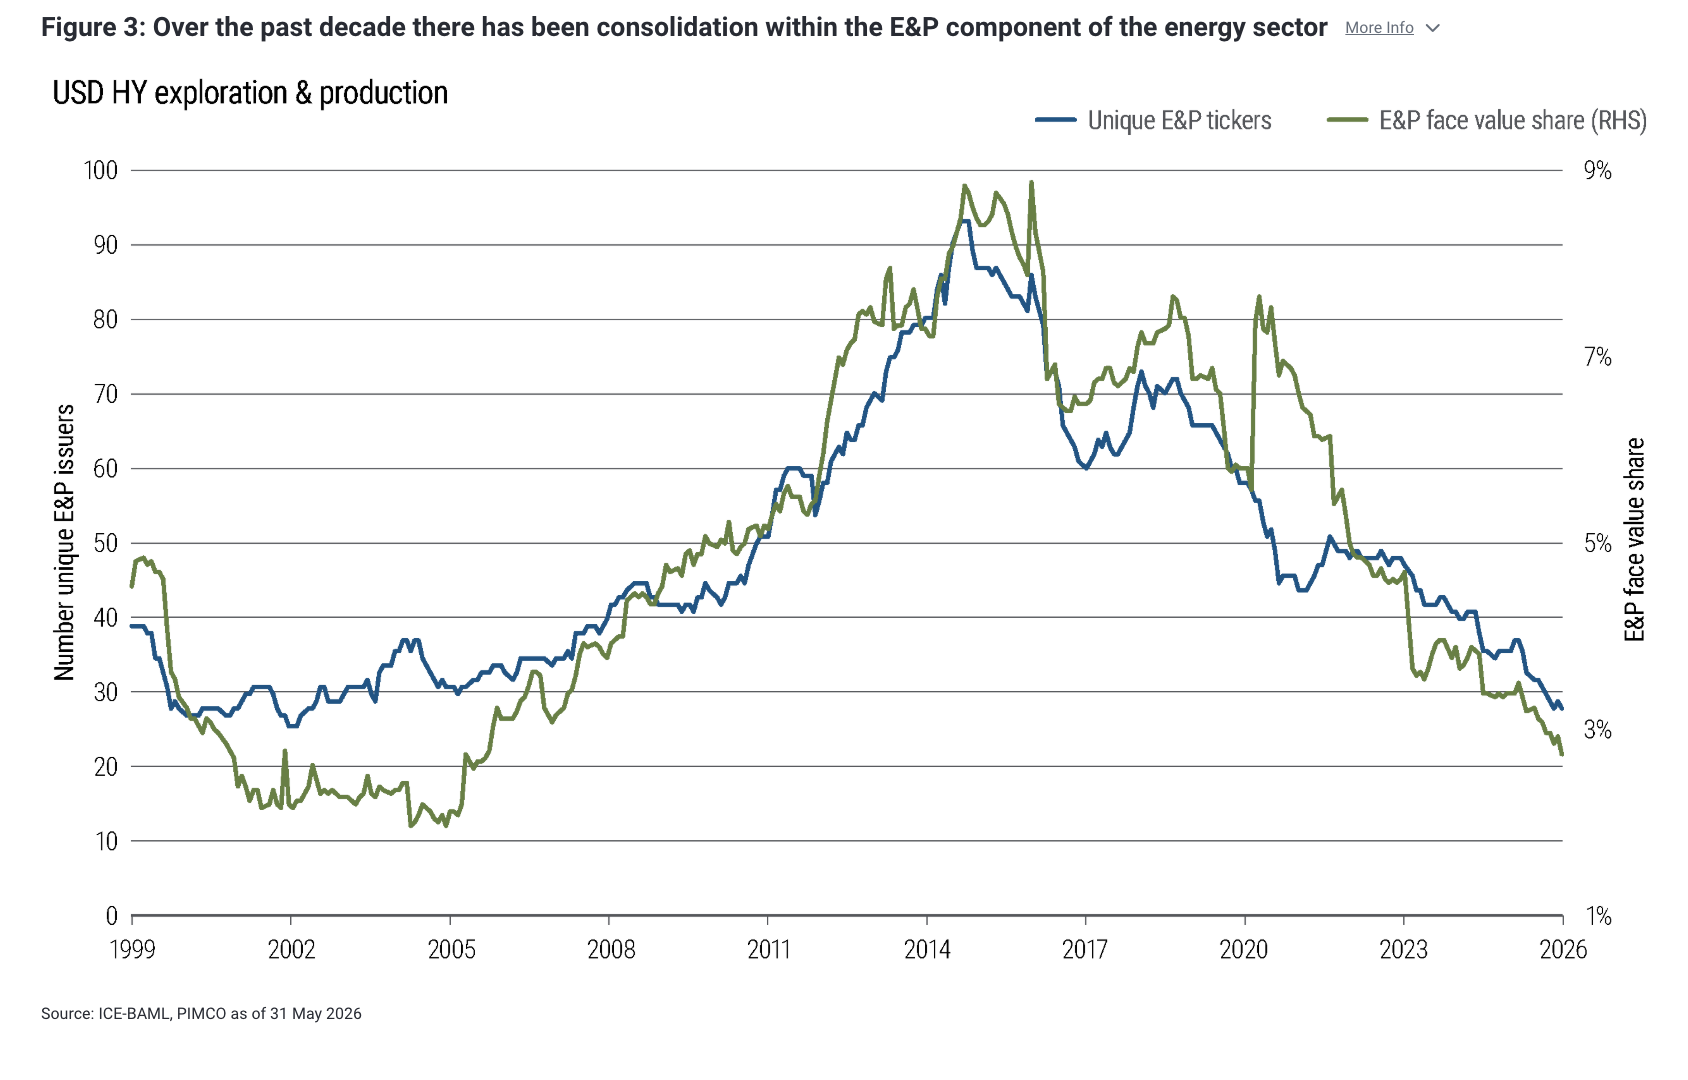
Second, the dollar-denominated HY energy universe has consolidated materially since the shale boom peaked in 2014. Figure 3 shows that in the past decade, the number of unique energy exploration and production (E&P) issuers in the USD HY Index has fallen from roughly 100, or about 9% of index par outstanding, to around 30, or roughly 3%, today. But the broader energy sector still accounts for just over 10% of index market value. We believe this divergence largely reflects the growing share of integrated oil companies with exposure across the entire supply chain. As a result, sector earnings are less dependent on drilling activity alone.
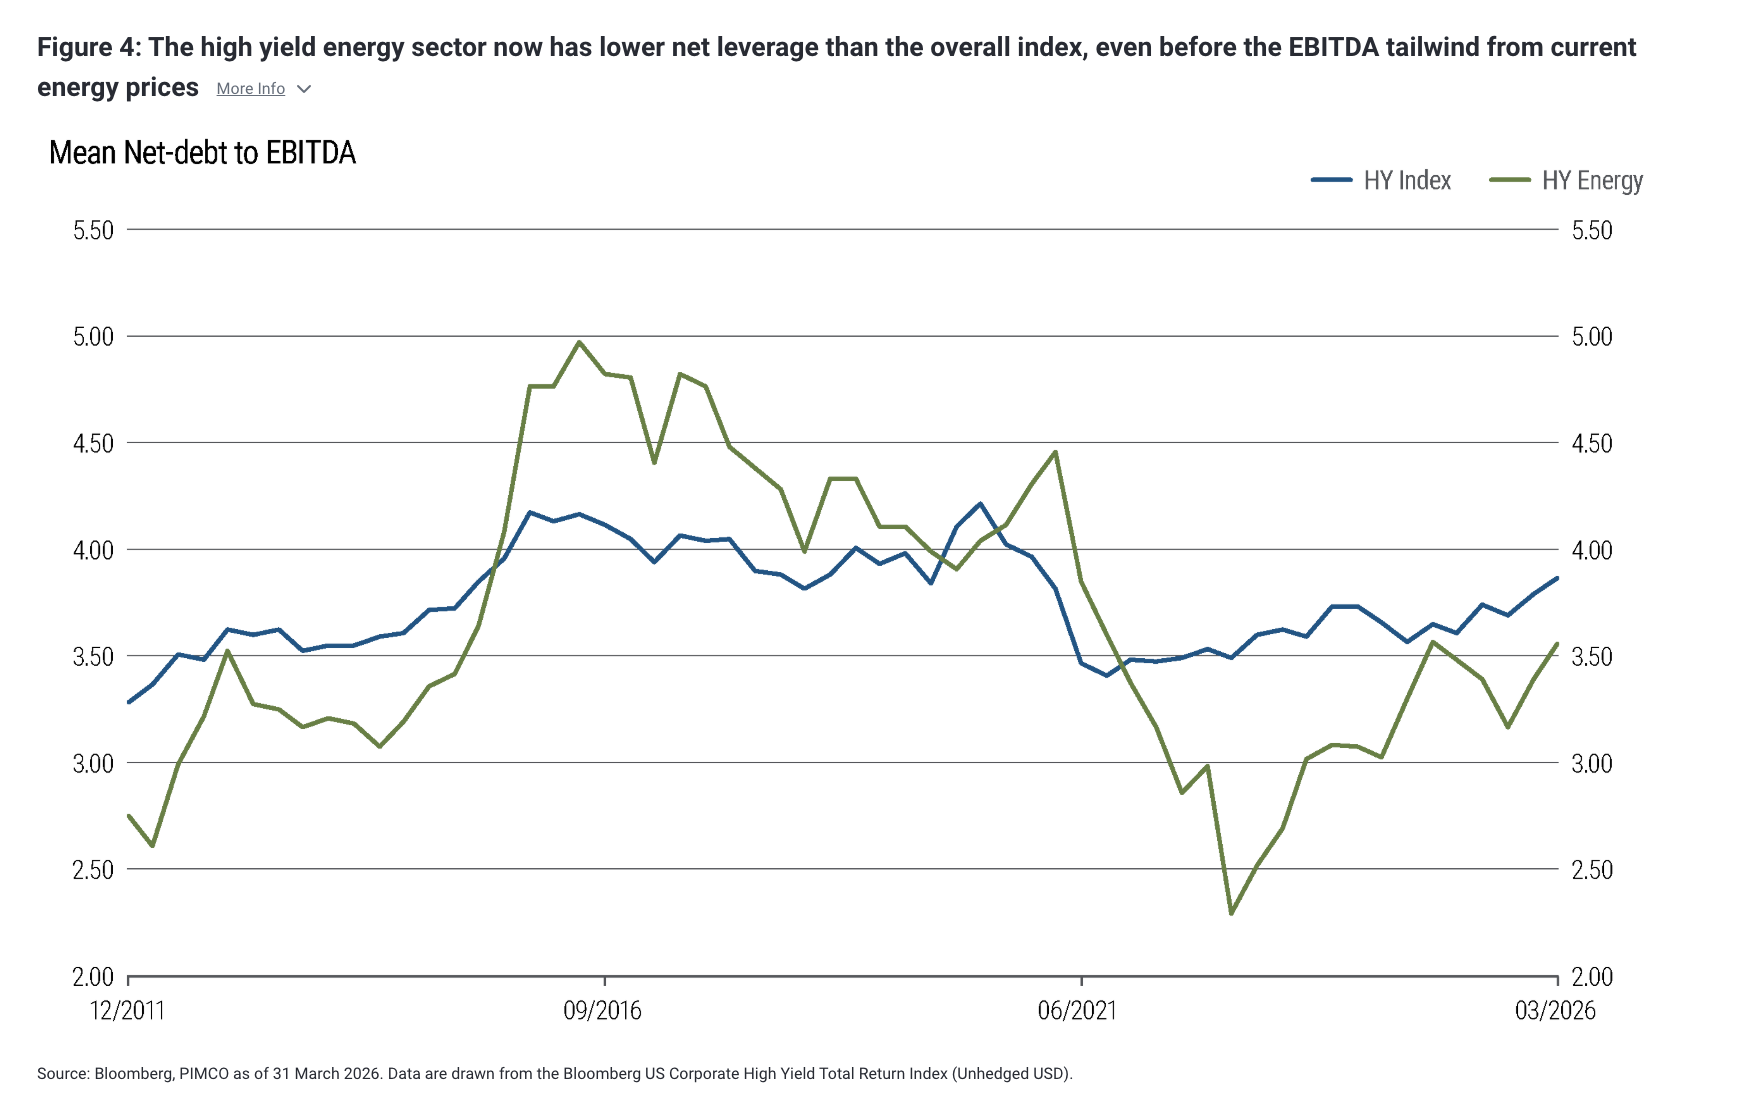
Lastly, Figure 4 shows that disciplined drilling and consolidation have driven a multi-year deleveraging cycle. From 2014 through the COVID-induced default wave, the energy sector consistently carried higher net leverage than the broader USD HY Index. Since the 2020 defaults cleared out the weakest index-eligible names, however, leverage has improved and the sector has become a higher-quality part of the HY market. We believe that dynamic should persist as higher energy prices support the sector’s EBITDA (earnings before interest, taxes, depreciation, and amortization) while management teams remain reluctant to pursue large, debt-funded capex programs.
Energy credit’s oil beta is regime-dependent
A second way to show that credit-friendly capital management, rather than just higher oil prices, has driven outperformance in energy credit is to compare relative sector performance across different oil price regimes.
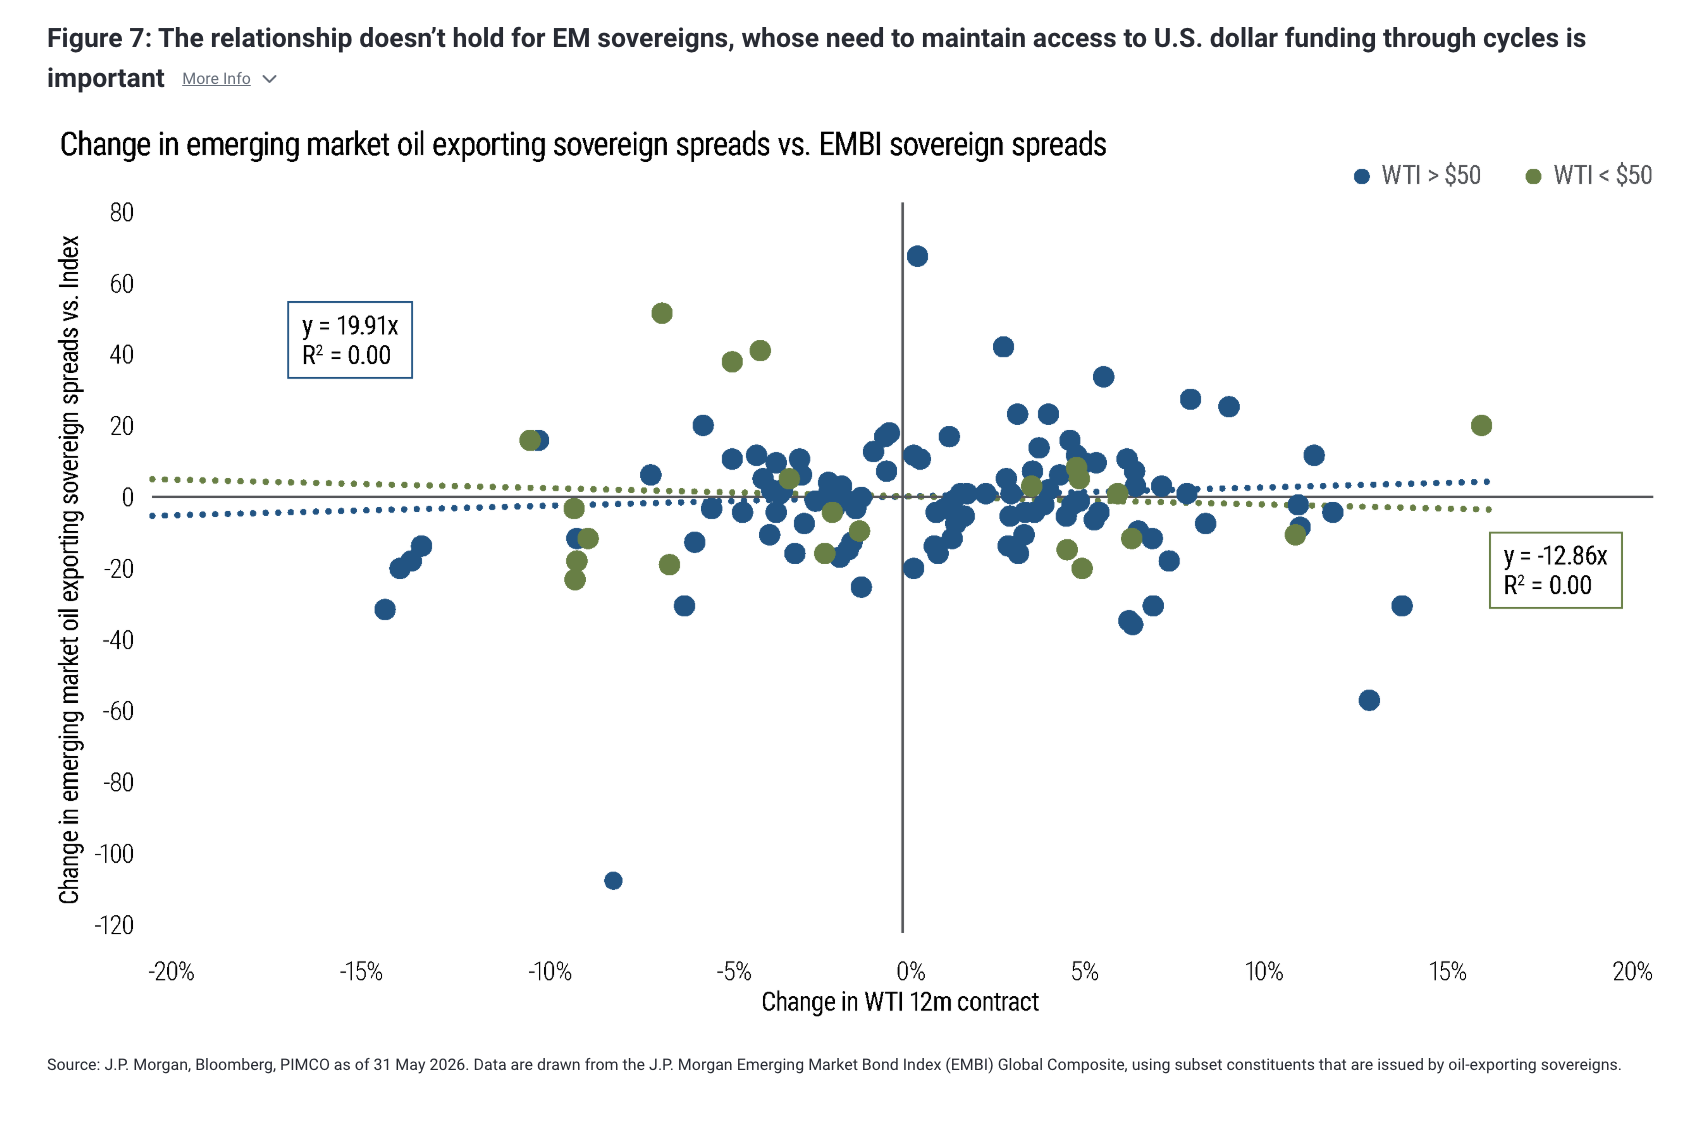
We use $50/barrel on the 12-month West Texas Intermediate (WTI) crude oil contract as an approximate breakeven threshold for oil production. Figure 5 shows the monthly excess returns from being long HY energy versus the USD HY Index above and below that threshold. Figures 6 and 7 repeat the same exercise for emerging market (EM) corporates and EM sovereigns, using changes in spread differentials rather than excess returns.
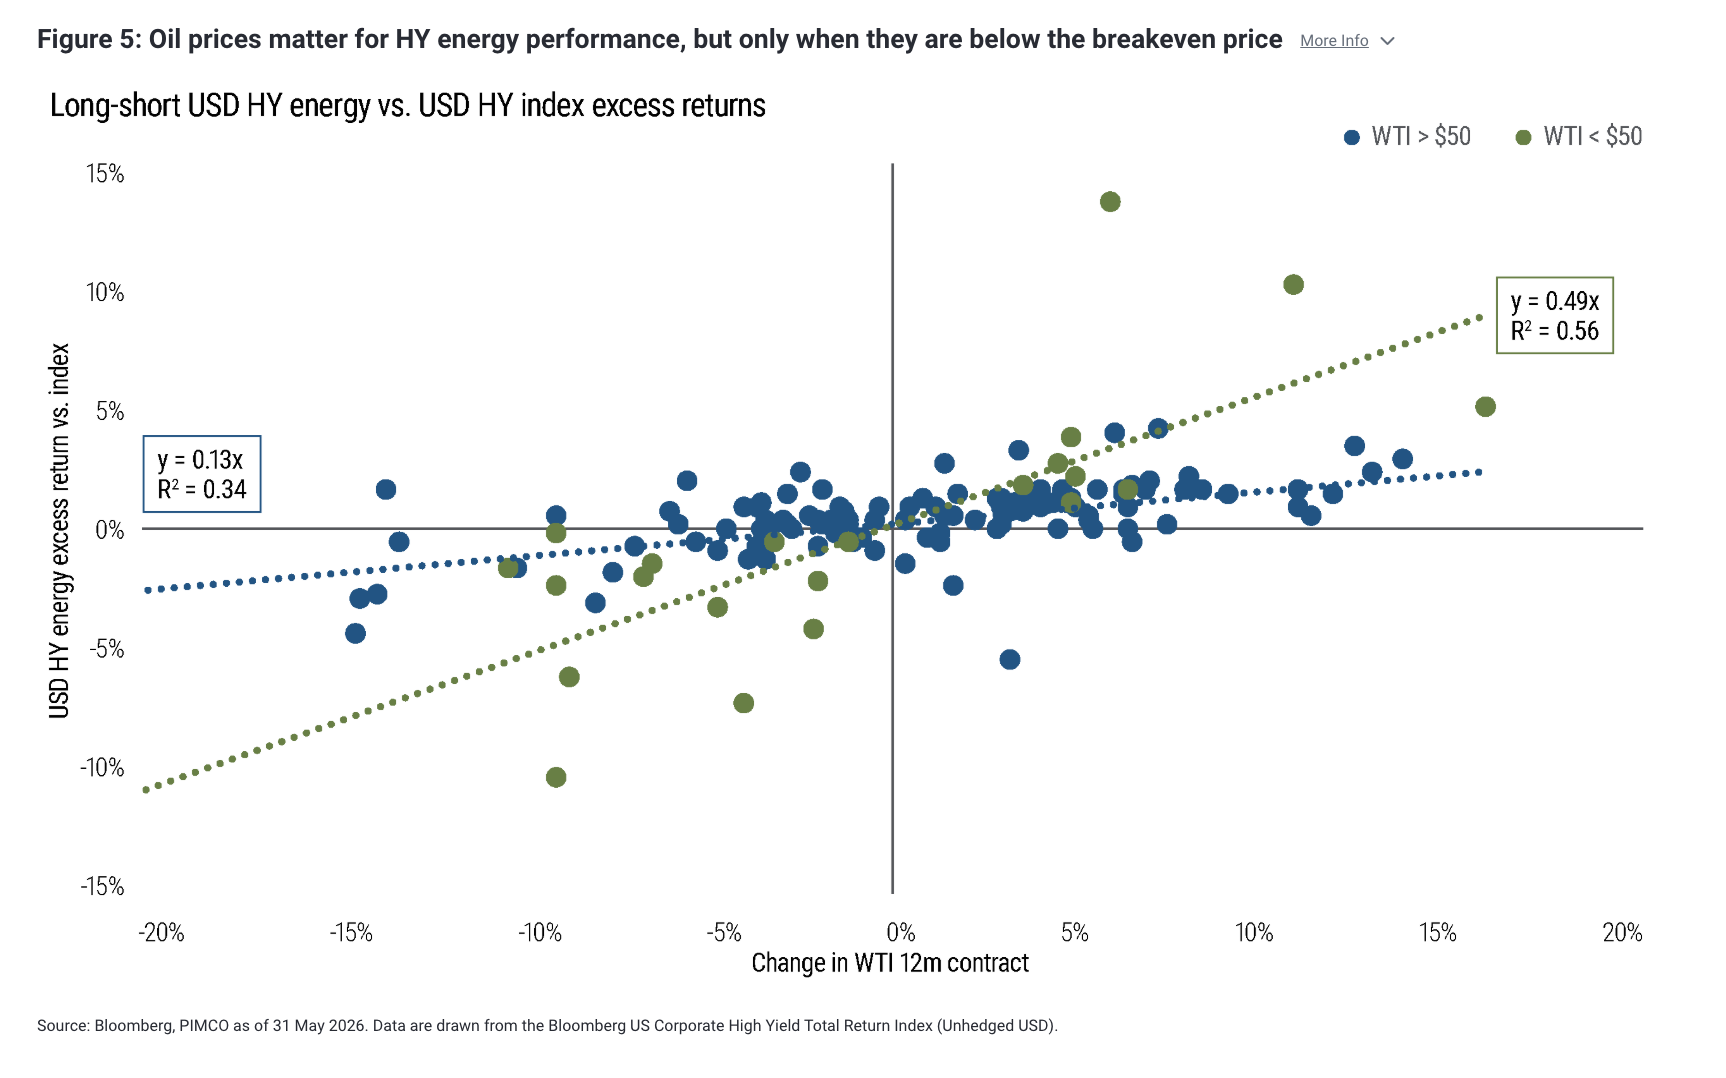
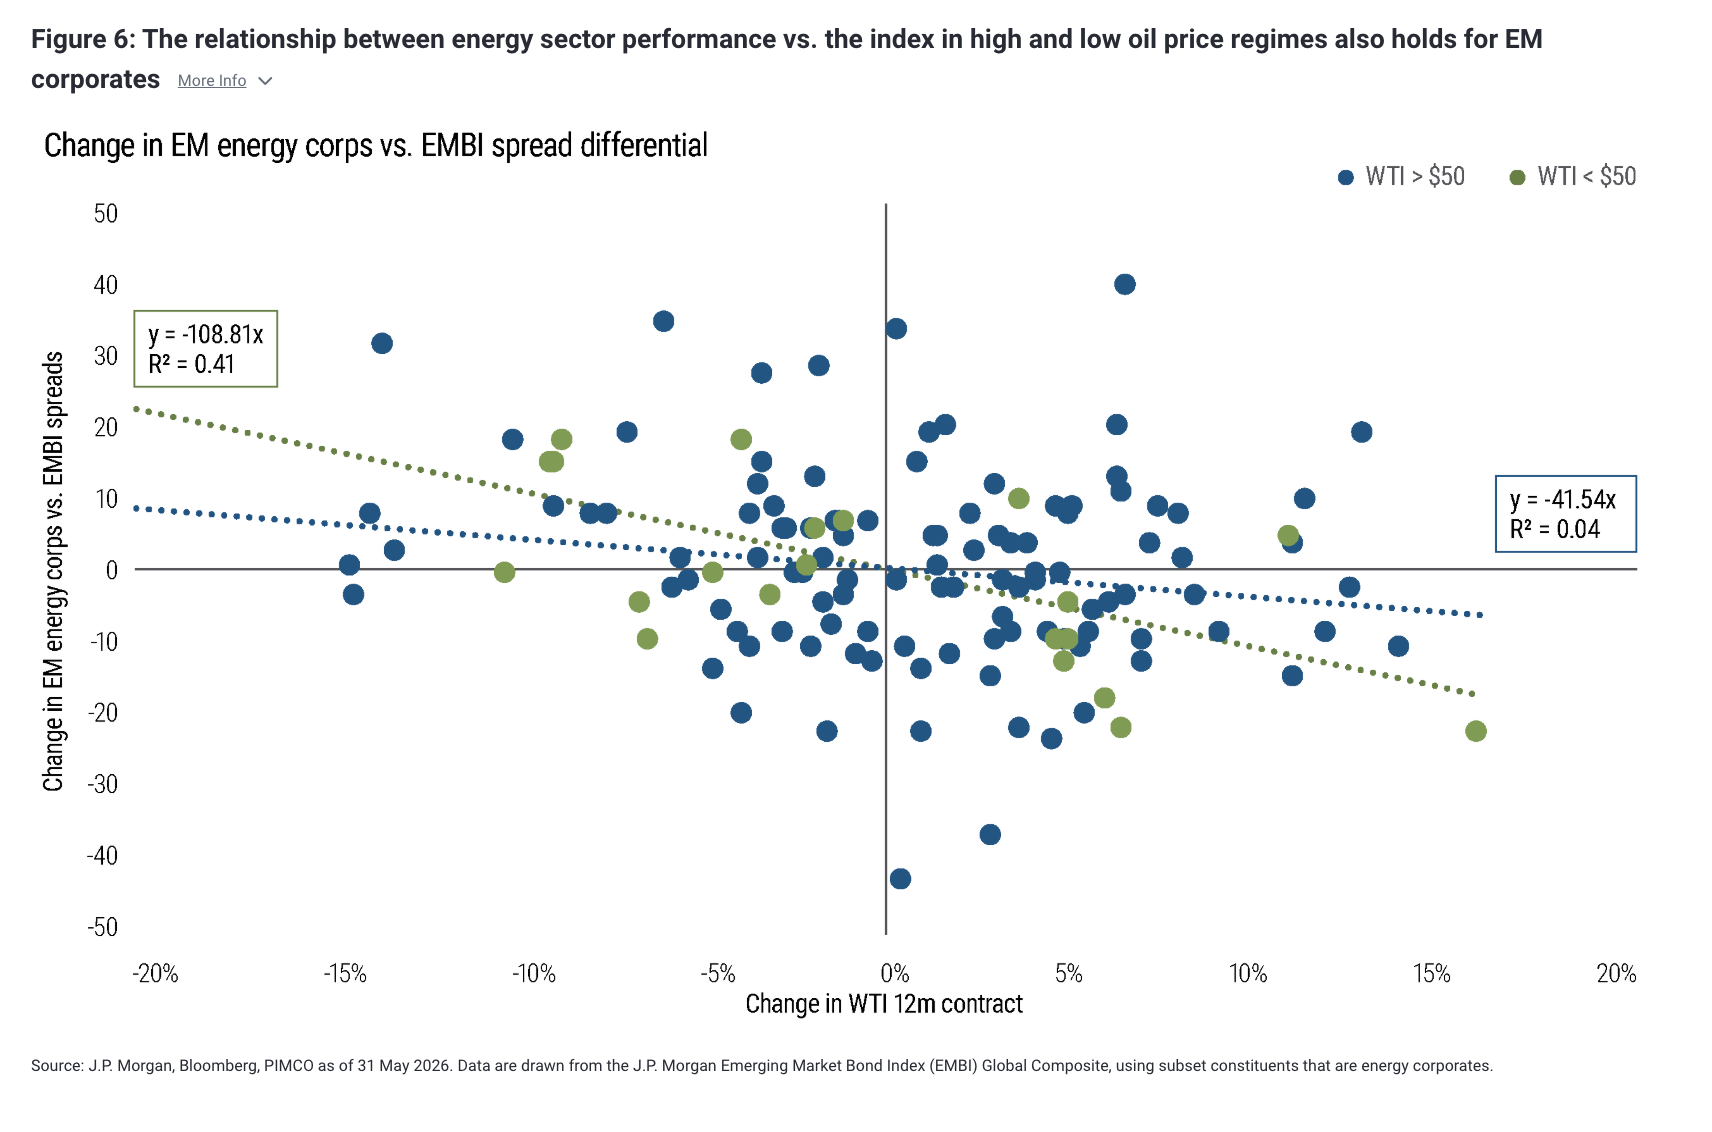
The takeaway for both HY and EM corporates is straightforward. Once oil prices are above breakeven, further moves in oil tend to matter less for credit performance.
In options terms, the put option embedded in energy firms’ credit is then deep out of the money, so its delta is low and changes in oil prices have a smaller effect on spreads. Below breakeven, the opposite is true: The energy sector becomes much more sensitive to oil prices, and relative performance beta rises materially.
Interestingly, Figure 7 shows that this relationship does not hold for oil-exporting EM sovereigns. Two factors help explain why. First, unlike corporates, sovereigns typically hold substantial U.S. dollar reserves that help service external debt and reduce the risk of spread stress when oil prices fall. Second, EM sovereigns’ effective fiscal breakeven is often lower than that of EM corporates: They can continue to collect export revenues without the same immediate weakening in their cash flows or balance sheets. That makes sovereign spreads less mechanically tied to oil prices, especially over shorter horizons.
Disclosure
Past performance is not a guarantee or a reliable indicator of future results. Charts are provided for illustrative purposes and are not indicative of the past or future performance of any PIMCO product. References to specific securities and their issuers are not intended and should not be interpreted as recommendations to purchase, sell or hold such securities. It is not possible to invest directly in an unmanaged index.
Statements concerning financial market trends and portfolio strategies are based on current market conditions, which will fluctuate. Outlook and strategies are subject to change without notice. There can be no assurance that the trends mentioned will continue.
Energy sector and pipeline companies are subject to the risk of changes in the demand for and availability of products for gathering, transportation, processing or sale due to natural declines in reserves, sharp decreases in crude oil or natural gas prices that curtail production, and environmental regulation. Gathering and processing companies are subject to natural declines in the production of oil and natural gas fields, prolonged declines in the price of natural gas or crude oil, and declines in the prices of natural gas liquids and refined petroleum products. Commodities contain heightened risk, including market, political, regulatory and natural conditions, and may not be appropriate for all investors. Investing in the bond market is subject to risks, including market, interest rate, issuer, credit, inflation risk, and liquidity risk. High yield, lower-rated securities involve greater risk than higher-rated securities; portfolios that invest in them may be subject to greater levels of credit and liquidity risk than portfolios that do not. Sovereign securities are generally backed by the issuing government. Investing in foreign-denominated and/or -domiciled securities may involve heightened risk due to currency fluctuations, and economic and political risks, which may be enhanced in emerging markets.
PIMCO as a general matter provides services to qualified institutions, financial intermediaries and institutional investors. Individual investors should contact their own financial professional to determine the most appropriate investment options for their financial situation. This material contains the opinions of the author and such opinions are subject to change without notice. This material has been distributed for informational purposes only and should not be considered as investment advice or a recommendation of any particular security, strategy or investment product. Information contained herein has been obtained from sources believed to be reliable, but not guaranteed. No part of this material may be reproduced in any form, or referred to in any other publication, without express written permission. PIMCO is a trademark of Allianz Asset Management of America LLC in the United States and throughout the world.
CMR2026-0605-5557496
A message from Advisor Perspectives and VettaFi: Discover something new! Click here to register for our upcoming webcasts.
© PIMCO
Membership required
Membership is now required to use this feature. To learn more:
View Membership BenefitsSponsored Content
Upcoming Virtual Events View All


