This article originally appeared in the Financial Times on 19 August 2026.
In the early weeks of Kevin Warsh’s start as chair of the U.S. Federal Reserve, there has been renewed focus on how “underlying” inflation should be measured to guide decisions on interest rates.
Common inflation measures, including the Fed’s preferred personal consumption expenditures (PCE) price index, have been above the central bank’s 2% target for five years. But at least some of this reflects higher energy prices and tariffs, which should not in the future be an ongoing source of underlying inflation. Neither tariffs nor oil prices can go up forever. And in the case of the latter, the futures market signals oil prices are expected to be lower over the next year.
So how should policymakers look at the underlying trend? Many popular measures of this are based solely on price data itself. For example, “core” inflation strips out food and energy prices; “trimmed mean” measures use statistical methods to strip away outliers in price changes; and “sticky price” inflation indices filter out the prices of goods whose prices adjust frequently.
While each of these measures has something to offer, all suffer from the same problem: They ignore evidence from the labor market and, in particular, wage gains adjusted for productivity growth.
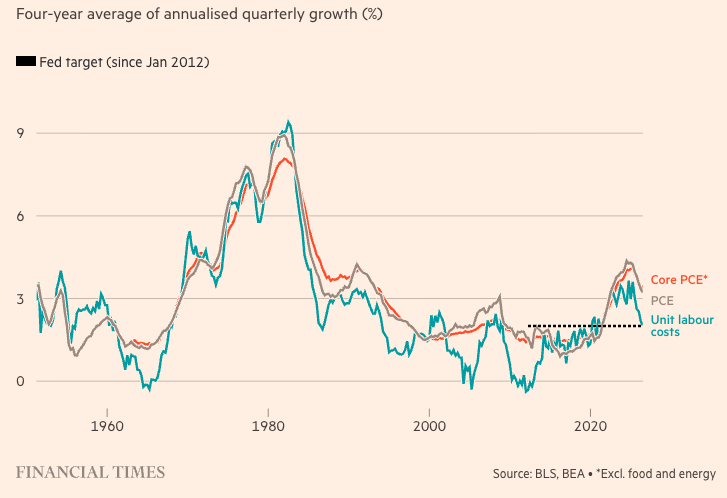
This is odd. In the U.S., labor compensation adjusted for productivity (referred to as unit labor costs) historically accounts for about 60% of value added in the nonfinancial corporate sector. In the postwar U.S. data (see Figure 1), all previous episodes of sustained and rising price inflation – including the 1960s, 1970s, and 2020s – have been accompanied by sustained and rising unit cost inflation. And all the times when inflation fell for lengthy periods – including the 1980s, 1990s, and 2020s – have been accompanied by falls in unit cost inflation.
Figure 1: Sustained inflation has historically moved with unit labor costs
This is not a coincidence. Indeed, in the workhorse theoretical models used by many central banks, unit cost inflation is a key input along with expected future price inflation. There are of course “shocks” such as those on energy or import prices as well as profit margins. Month to month these are important but over the medium term – say three to five years – the underlying trend on prices tends to track unit cost and expected inflation reasonably closely.
This brings us to today. Using a four-year average to smooth out shocks and noise (see Figure 1 above), the most recent data, released earlier this month, show that unit cost inflation over the past four years has averaged 2% and during the past year is running at 1.5%.
This pace is actually running at or a bit below the measure of underlying inflation in 2018–2019 before the pandemic, when measures of rising prices were at or below the Fed’s 2% target.
Importantly, unit cost inflation is falling for two reasons: Wage inflation is reducing and productivity growth is rising. Indeed, over the past 12 months, average hourly earnings have risen at the slowest pace in seven years and measures of underlying productivity growth are increasing at the fastest pace in more than a decade.
Although forecasting is hard – especially about the future – it is reasonable to expect underlying unit cost inflation to continue to run at or below the 2% pace consistent with the Fed’s target.
Employment growth has been sluggish for some time and the unemployment rate has been falling for the wrong reason: declining prime-age labor force participation.
If anything, it is plausible to expect productivity growth to rise in coming years as AI is deployed and diffused more broadly in the economy. Indeed, the debate among experts is not whether AI will boost productivity above the current pace but by how much.
Which brings us back to the Warsh Fed and the focus on underlying inflation. The labor market is not a source of underlying inflation today. Actual inflation is running above the 2% target for other reasons, which today include increases in computer chip and electricity prices pushed up by the hyperscaler investment boom.
Moreover, unlike in previous business cycle expansions when labor’s share of national income has tended to rise, in recent years it has been falling.
Inflation remains too high, and the Fed may decide it needs to raise rates – perhaps to keep inflation expectations anchored – but not because too many people are working.
A message from Advisor Perspectives and VettaFi: Discover something new! Click here to register for our upcoming webcasts.
Disclosures
PIMCO as a general matter provides services to qualified institutions, financial intermediaries and institutional investors. Individual investors should contact their own financial professional to determine the most appropriate investment options for their financial situation. This material contains the opinions of author and such opinions are subject to change without notice. This material has been distributed for informational purposes only and should not be considered as investment advice or a recommendation of any particular security, strategy or investment product. Information contained herein has been obtained from sources believed to be reliable, but not guaranteed. No part of this material may be reproduced in any form, or referred to in any other publication, without express written permission. PIMCO is a trademark of Allianz Asset Management of America LLC in the United States and throughout the world.
Pacific Investment Management Company LLC (“PIMCO”) is an investment adviser registered with the U.S. Securities and Exchange Commission (“SEC”). PIMCO Investments LLC (“PIMCO Investments”) is a broker-dealer registered with the SEC and member of the Financial Industry Regulatory Authority, Inc. (“FINRA”). PIMCO and PIMCO Investments is solely responsible for its content. PIMCO Investments is the distributor of PIMCO investment products, and any PIMCO Content relating to those investment products is the sole responsibility of PIMCO Investments.
The information provided herein is not directed at any investor or category of investors and is provided solely as general information about our products and services and to otherwise provide general investment education. No information contained herein should be regarded as a suggestion to engage in or refrain from any investment-related course of action as none of PIMCO nor any of its affiliates is undertaking to provide investment advice, act as an adviser to any plan or entity subject to the Employee Retirement Income Security Act of 1974, as amended, individual retirement account or individual retirement annuity, or give advice in a fiduciary capacity with respect to the materials presented herein. If you are an individual retirement investor, contact your financial advisor or other fiduciary unrelated to PIMCO about whether any given investment idea, strategy, product or service described herein may be appropriate for your circumstances.
Check the background of this firm on FINRA's BrokerCheck.
Account Managers Compensation
PIMCO is a trademark of Allianz Asset Management of America LLC in the United States and throughout the world. ©2026 PIMCO. All Rights Reserved. Investment Products: NOT FDIC INSURED | MAY LOSE VALUE | NOT BANK GUARANTEED.
© PIMCO
Read more commentaries by PIMCO