Key takeaways:
- Defaults are not created equal. As the credit cycle ages, default rates will remain central to assessing credit quality, but headline comparisons between public and private markets can be misleading. This is because direct lending stress is often resolved in less visible ways.
- The shadow default signal is mixed. Using a framework that captures a range of underlying loan data, we find that financial distress in direct lending portfolios has risen meaningfully since 2022 – though this deterioration has recently begun to plateau.
- Direct lending is leading the downward cycle for now. Over the past few years, credit stress appears to be building faster in direct lending than in high yield bonds, where shifts since the global financial crisis have left the market with unusually high credit quality by historical standards.
As the credit cycle ages, defaults are likely to remain front and center. But for investors evaluating private credit alongside public markets, measuring defaults is not as straightforward as it may seem.
The challenges lie in weighing how severely borrowers are becoming distressed and also in determining how that distress is recorded. Public debt markets rely on standardized, easily observable measures of credit deterioration, such as credit ratings from well-known rating agencies. Private markets, by contrast, often resolve stress through less visible mechanisms. Comparing default rates thoughtfully across the two requires deeper analysis of data beneath the headline statistics.
See more: Anatomy of the Private Credit Market
Public defaults are visible; private stress is often negotiated
In public debt markets, measuring default trends appears simple because it is easily observed. The three major rating agencies look at three events when assessing default: a missed payment beyond the grace period, a bankruptcy, or a distressed exchange in which debt terms (such as maturity, coupon, or principal) are restructured. Moody’s counts distressed exchanges directly, though it makes a distinction between distressed exchanges and hard defaults. S&P’s Selective Default and Fitch’s Restricted Default categories serve much the same purpose. Each event is anchored in observable contractual terms or publicly disclosed transactions. Distress, in other words, cannot easily be negotiated outside the empirical record.
Direct lending distress can echo that of public credit, but it’s much harder to observe. With a single lender or small club of lenders, stress can be resolved bilaterally through waivers, amend-and-extend transactions, or cash-to-payment-in-kind (PIK) conversions. These may be economically equivalent to distressed exchanges, but they are not always classified that way. Most loans are also unrated, forcing third-party trackers to rely on different methodologies and definitions. The result is a wide range of headline default estimates that can materially misstate – and usually underestimate – the underlying market stress.
Building a shadow default rate estimate for direct lending
Building a comparable default rate measure for direct lending therefore requires an event-based approach. We focus on five types of default events:
- Default payment
- Non-accrual (i.e., collection of contractual payments is deemed doubtful)
- Post-origination cash-to-PIK conversion (PIK optionality at origination is excluded)
- Material maturity extension of the original loan
- Debt-to-equity swaps
We would emphasize that we are taking the union of these events, so there is no double-counting: A borrower experiencing multiple events is counted only once in that order.
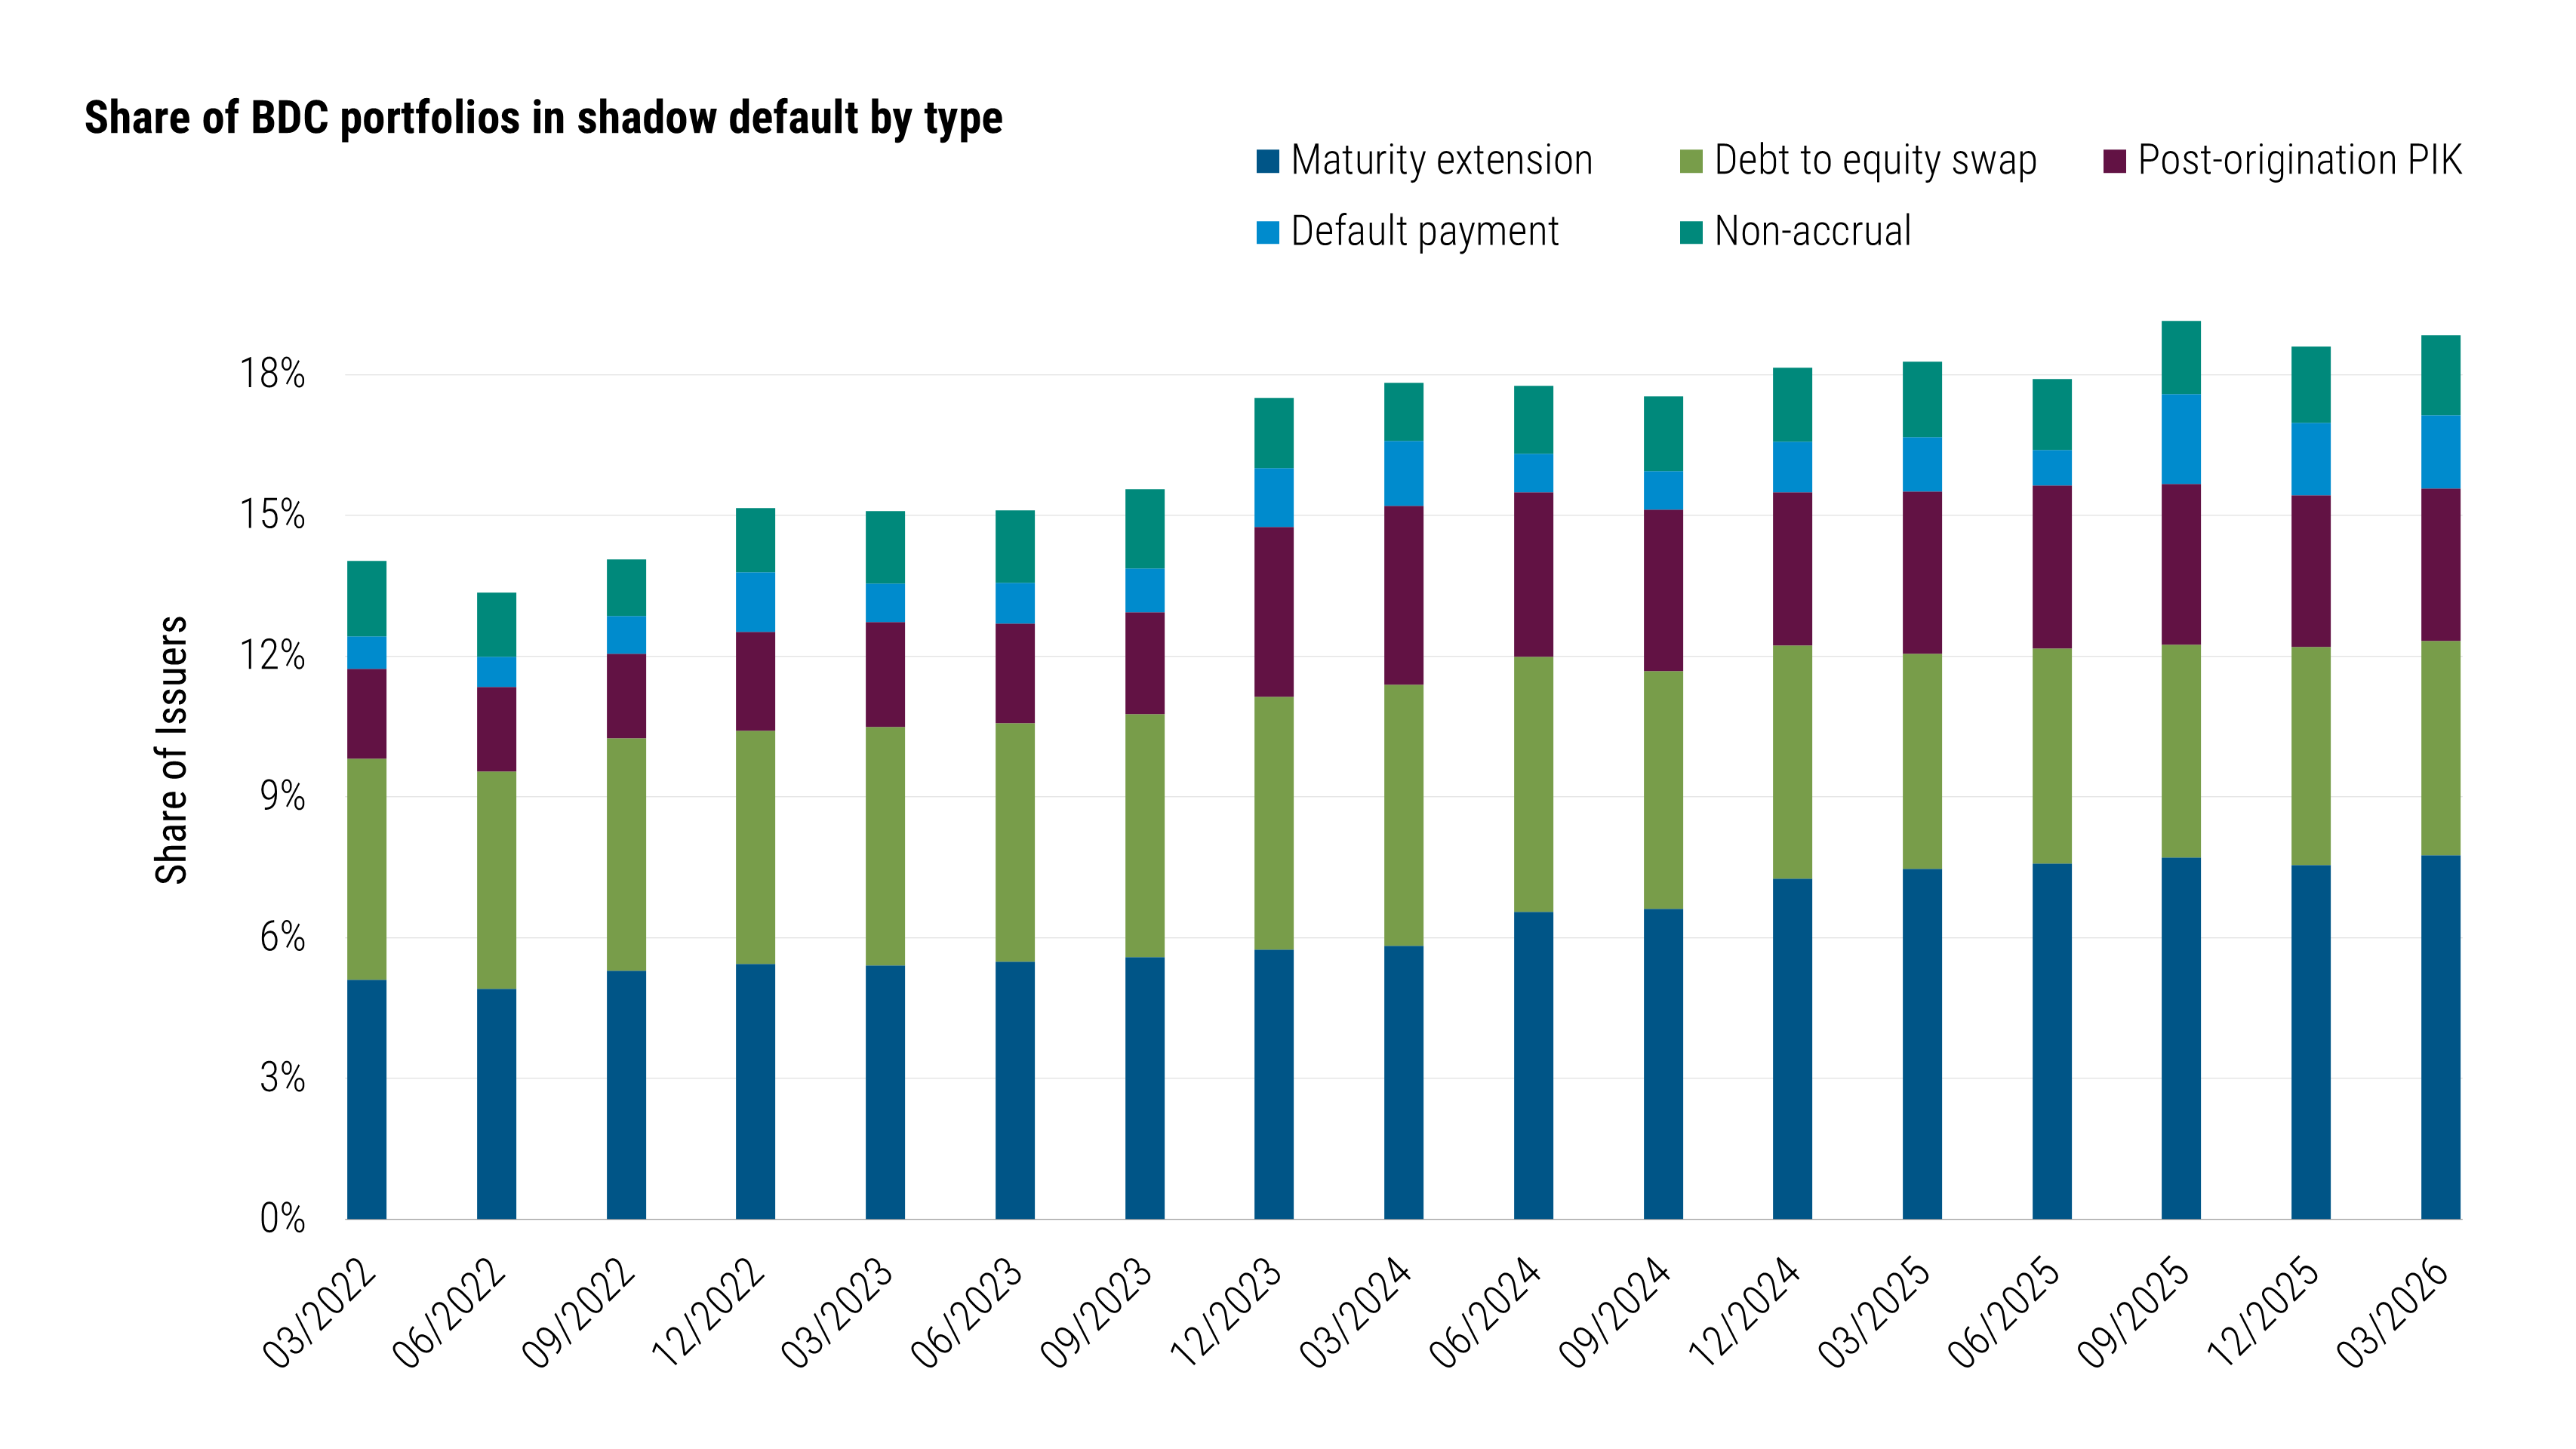
Figure 1 illustrates this “shadow default” analysis for business development companies (BDCs); BDCs are funds that invest in small and midsize private U.S. businesses. The figure shows the share of first and second lien secured loans (by issuer) in BDC portfolios that are in one or more of the five default states in any given quarter. This is explicitly a stock measure: Once flagged, an issuer remains classified as distressed while that condition persists. Conceptually, it’s similar to the 90-day-plus delinquency rate commonly reported in consumer credit.
Figure 1: Our shadow measure of the share of BDC issuers in a default state is notably greater than it was in 2022
Source: PitchBook data, PIMCO calculations as of 31 March 2026
There are two takeaways from Figure 1. The first is that the bulk of default events are soft in nature, involving debt-to-equity swaps, maturity extension, and post-origination cash-to-PIK conversion. The second is that, taken at face value, our shadow default rate measure has risen significantly since 2022 from roughly 14% to 19%, even if it has recently begun to plateau.
Measuring against other areas of leveraged finance
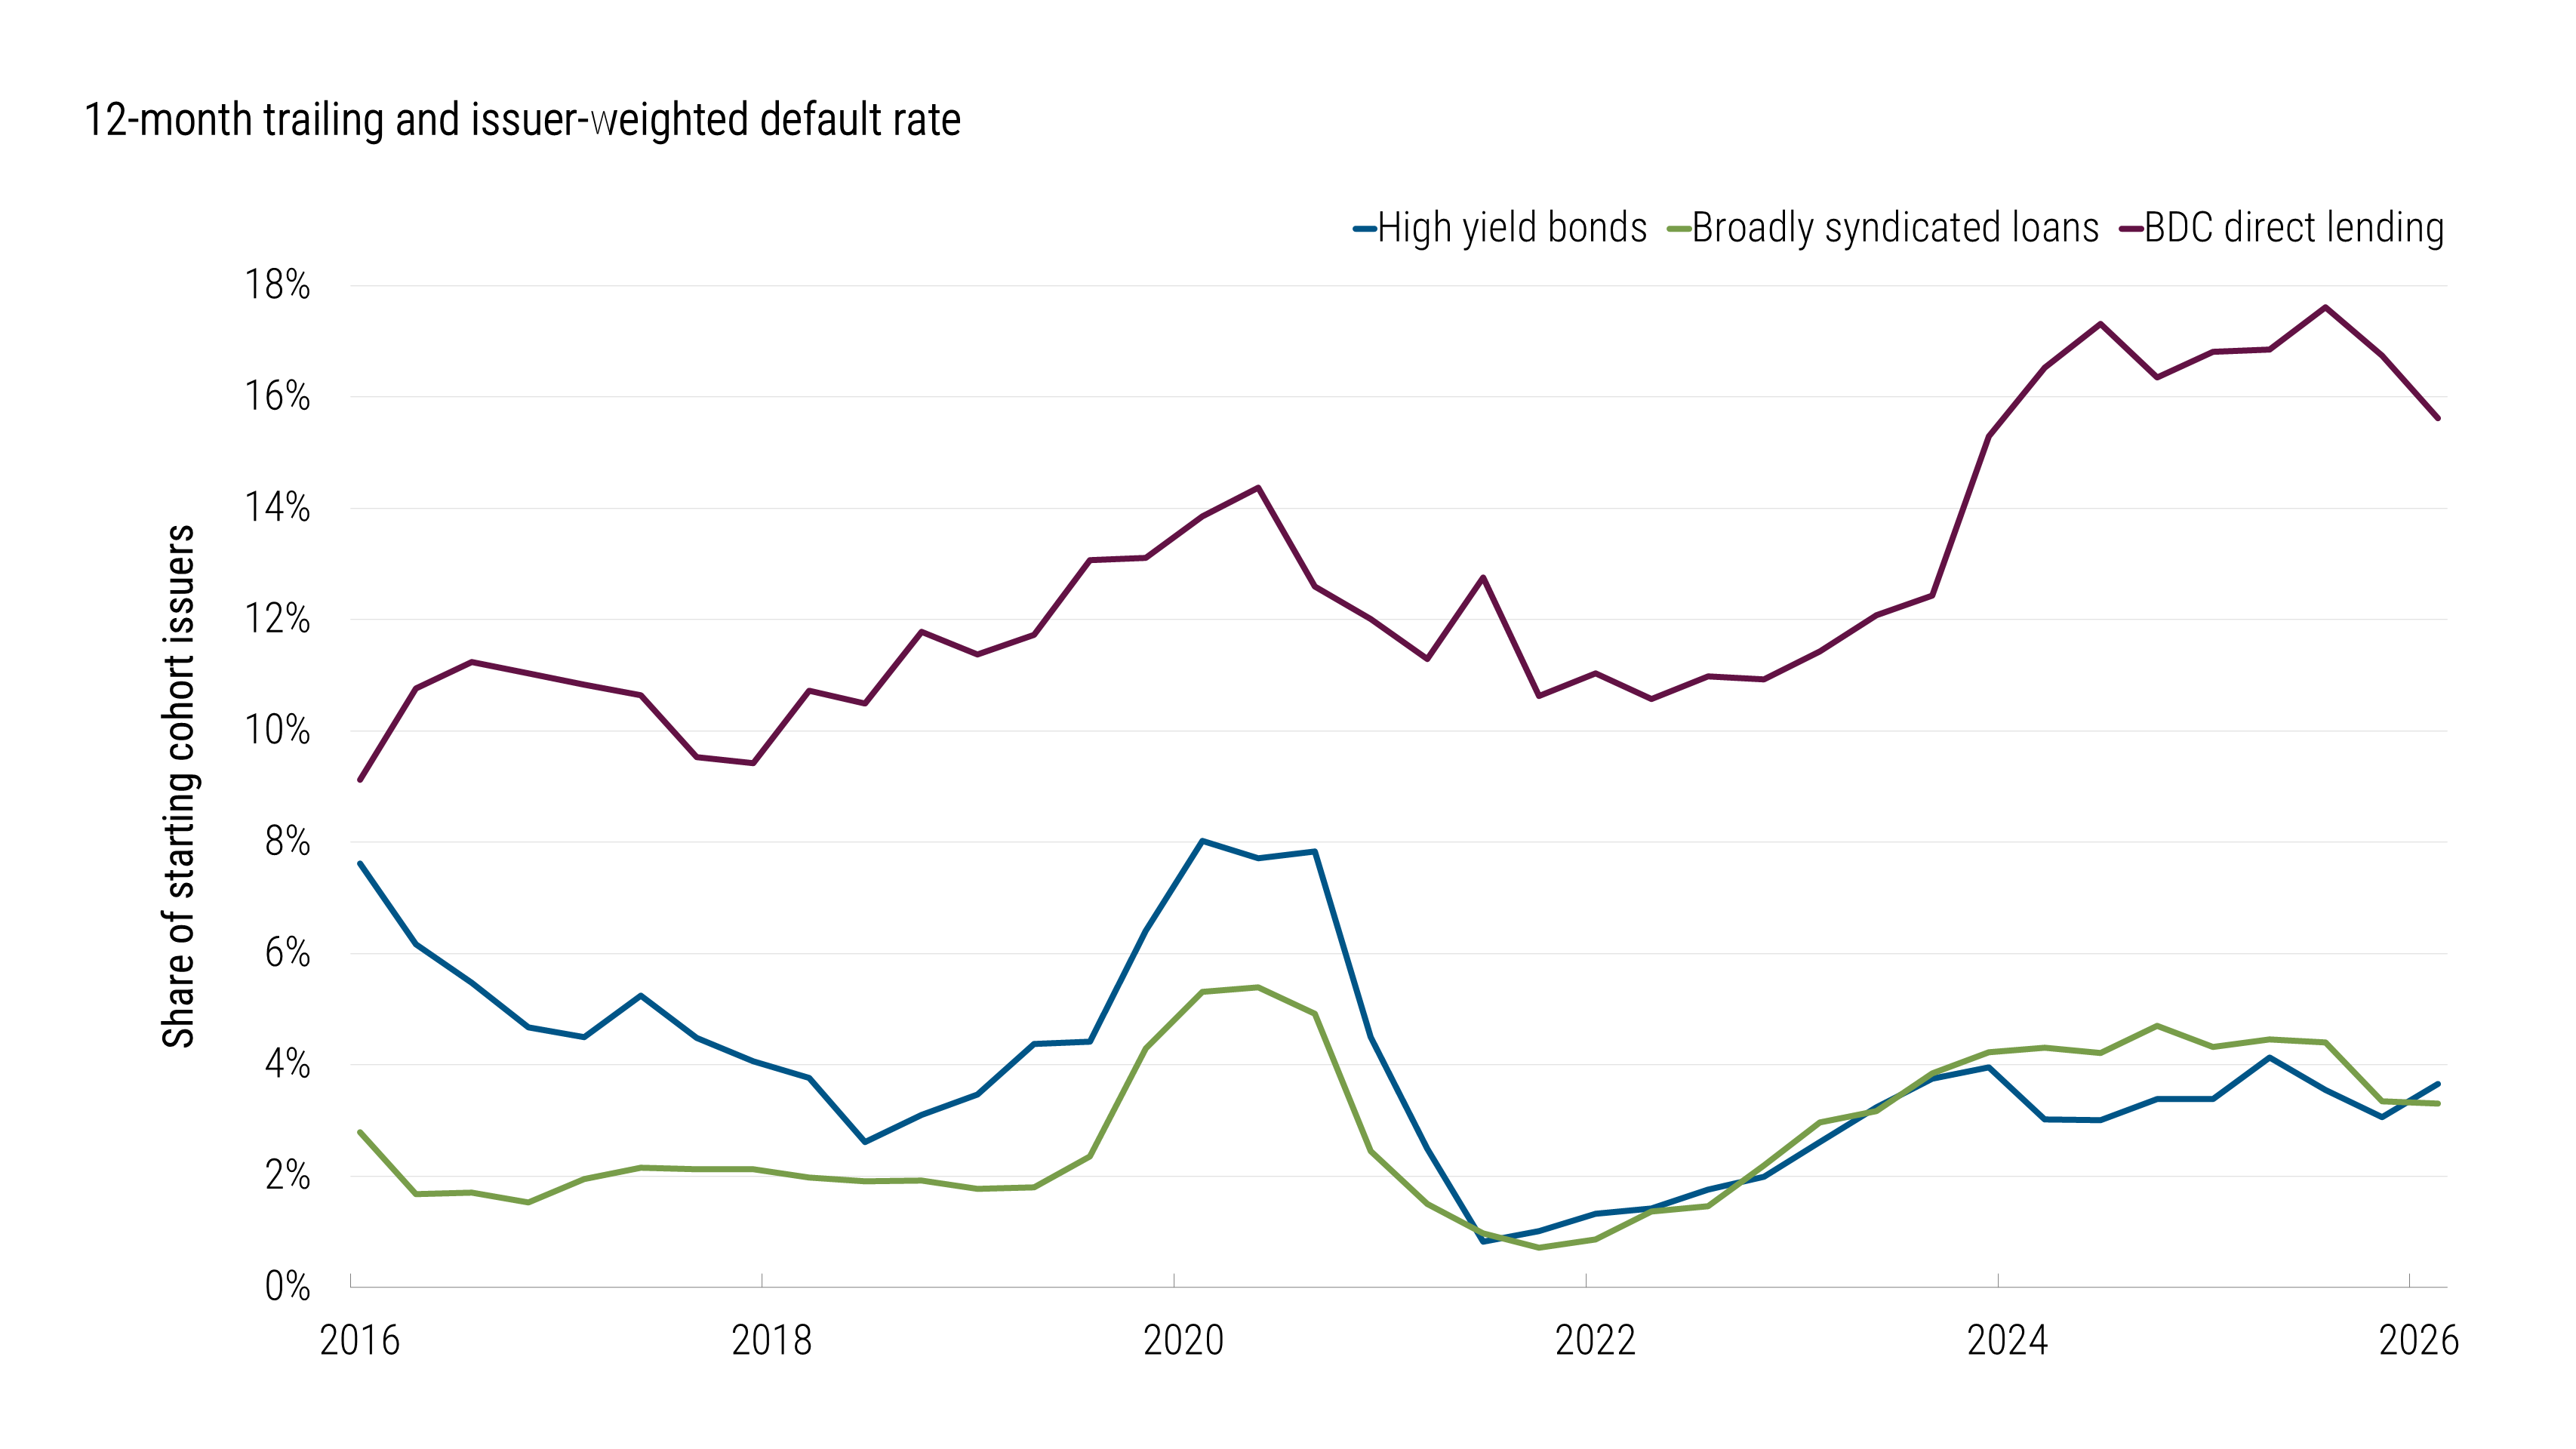
To compare direct lending with the 12-month default rates in the high yield (HY) bond and broadly syndicated loan (BSL) markets, we form quarterly cohorts of first and second lien secured loans, and calculate the share experiencing at least one qualifying event over the subsequent four quarters, which we call the 12-month trailing and issuer-weighted shadow default rate.
In our calculations, we deliberately use the original cohort as a fixed denominator: Loans that repay or refinance cleanly before the end of the 4-quarter window remain classified as non-defaults. This is conservative because it effectively assumes those loans would have stayed performing for the remainder of the period.
Figure 2 plots our shadow BDC measure alongside comparable public market default rates (inclusive of distressed exchanges). The comparison is necessarily imperfect. We have sought to harmonize definitions across markets, but differences in instruments, borrower populations, disclosures, and agency methodologies prevent a true apples-to-apples comparison. It is an estimate – a conservative approximation – particularly given the treatment of clean exits and the judgment required to identify distressed concessions.
Figure 2: Our estimates suggest a credit cycle may be taking shape at a faster pace in direct lending than in other segments of leveraged finance
Source: Moody’s and PitchBook data, PIMCO calculations as of 31 March 2026. High yield bond universe shown is all U.S. corporates tracked by Moody’s. Broadly syndicated loans (BSLs) are proxied by the Morningstar LSTA US Leveraged Loan Index. Business development companies (BDCs) include all BDCs reporting data through PitchBook with at least $100 million (USD) in assets.
With those caveats in mind, the message from the data is nevertheless striking: A credit cycle appears to be taking shape at a faster pace in direct lending than in other segments of leveraged finance, particularly the HY bond market.
That divergence is consistent with our discussion in the 6 July edition of The Credit Market Lens: The credit quality of today’s HY bond market is unusually high by historical standards, thanks to considerable compositional improvements in the aftermath of the global financial crisis.
Michael Puempel and Gabriel Cazaubieilh contributed to this report.
Disclosures
Statements concerning financial market trends or portfolio strategies are based on current market conditions, which will fluctuate. Outlook and strategies are subject to change without notice.
Past performance is not a guarantee or a reliable indicator of future results. Forecasts, estimates and certain information contained herein are based upon proprietary research and should not be considered as investment advice. There is no guarantee that stated results will be achieved.
All Investments contain risk and may lose value. An investment in a business development company (BDC) is subject to credit and investment risk, leverage risk, market and valuation risk, price volatility risk, liquidity risk, interest rate risk and structural and regulatory risk. Broadly syndicated loans (BSL) involve interest rate and market risk, credit risk, default risk, liquidity, structural and legal risks. Private credit involves an investment in non-publicly traded securities which may be subject to illiquidity risk. Portfolios that invest in private credit may be leveraged and may engage in speculative investment practices that increase the risk of investment loss. High yield, lower-rated securities involve greater risk than higher-rated securities; portfolios that invest in them may be subject to greater levels of credit and liquidity risk than portfolios that do not.
References to specific securities and their issuers are not intended and should not be interpreted as recommendations to purchase, sell or hold such securities. It is not possible to invest directly in an unmanaged index.
PIMCO as a general matter provides services to qualified institutions, financial intermediaries and institutional investors. Individual investors should contact their own financial professional to determine the most appropriate investment options for their financial situation. This material contains the opinions of the author and such opinions are subject to change without notice. This material has been distributed for informational purposes only and should not be considered as investment advice or a recommendation of any particular security, strategy or investment product. Information contained herein has been obtained from sources believed to be reliable, but not guaranteed. No part of this material may be reproduced in any form, or referred to in any other publication, without express written permission. PIMCO is a trademark of Allianz Asset Management of America LLC in the United States and throughout the world.
A message from Advisor Perspectives and VettaFi: Discover something new! Click here to register for our upcoming webcasts.
© PIMCO
Read more commentaries by PIMCO