Headlines are popping up left and right about how high the 10-year Treasury yield has risen. While investors make decisions about what is the “right” longer-term cost of government debt, many journalists focus on single-factor ways of viewing it. They will support the ideas that it is tariffs, or government spending and so on and so forth. We will seek to provide a multi-factor view of this and discuss what investors are missing in plain sight.
On History
Humans eat, sleep, and extrapolate. What we think we can foresee is often nothing more than what we have recently seen. “More of the same” is the sensible default prediction in politics, baseball, and interest rates alike. In rates, it actually tends to work. – Jim Grant in Barron’s Magazine, 2019
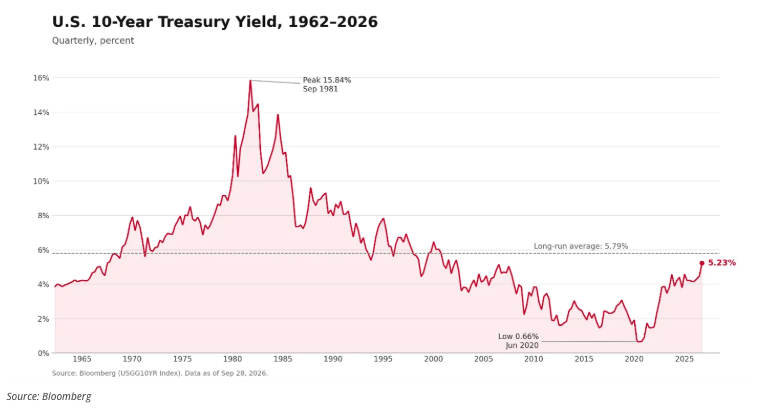
Grant’s words resonate loud and clear for the history-minded learner. To begin this framework, we want to ensure readers, particularly millennials and later generations, understand where we have been. Below is a look at the 10-year Treasury note since 1962.
The long-term average of this is 5.79% as noted in the chart. This teaches us that today’s rates are fairly normal, but most market participants (and governments) are shocked at how quickly they have risen to normal. As Grant would say, “more of the same” finally didn’t work.
See more: Tug-of-War: Who is Setting Interest Rates?
On Government Spending
Writers and pundits are constantly talking about our deficits while politicians do not. You don’t get elected by talking about cutting the budget. That won’t change in short order, but it isn’t a factor that has recently changed either. The US federal budget has been running deficits of 5% of GDP or worse since the pandemic began. Looking back at data since 1930, we have only experienced fiscal problems of this magnitude during World War II, the 1982 recession and the Great Financial Crisis. When taken in this context, it doesn’t seem to reach the historical precedent in 2026 for the purposes we are creating this debt for. Also, Billy Joel wrote Allentown in 1982 to explain what was going on. I don’t think Ella Langley’s “Choosin’ Texas” (great song) will carry the same cultural significance. Regardless, this isn’t changing any time soon, but it has not been a sea change over the last couple of years. Maybe investors care more now in 2026 and are voting with their feet like the bond vigilantes of the past? Inflation is persistent, but, then again, so are deficits.
On Trade Wars
Liberation day was the shot across the bow on this factor as investors needed to begin to look at Trump 1.0 as benign, comparatively. The rhetoric and tenor of this is vastly different than the past. All you have to do is take a trip across the US-Canadian border to learn that this has not been welcomed. As supply chains adjust, the cost of these adjustments must be passed through as it affects the cost of capital. While we can see this in the companies we own like Pandora (PNDORA), Target (TGT) and Spin Master (TOY), the academics seem ready to back this argument.1 Keeping it simple, uncertainty raises cost, and this is affecting the government’s cost of debt marginally, but is not the largest factor in our opinion.
On Buyers
Foreign ownership of US federal debt has grown from 5% in 1970 to 32% in 2025.2 Among the 68% owned by domestic holders, 25% is owned by mutual funds, 25% by the Federal Reserve and the rest is held by state and local governments, pension funds and depository institutions. Many of the domestic institutions, like mutual funds, deposit institutions, and insurance companies, are what we consider return following groups. They will do something until they begin to lose money. As the rise in rates shown earlier from the pandemic low to today has been dramatic, this has likely cooled interest for these investors stepping into higher rates as quickly as the US government would hope. Go walk around wealth management firms and pitch a risk-free 5% return. We believe you’ll have trouble finding buyers.
For the foreign owners, we are in a different dollar world today. We are in what we call a fractured dollar environment, where the geopolitical problems are likely spilling over into government debt, in our opinion. Russia and its wealth have been shut off from Western capital since 2022. That’s a small source of capital missing. As supply chains are reshaping around military and political alliances, you can also see that China doesn’t own the Treasuries it did in the past. In the last 10 years, they went from owning $1.265 trillion to $683 billion. The debt is growing and their ownership has shrunk. Europe has grown its ownership significantly during this time. Again, it’s following more geopolitical lines. Change costs money, and we believe the buyer market movements have added cost. Hard to quantify the cost, though.
On Other Uses of Capital
The most underestimated cost, in our opinion, is the alternative demand for capital. Before this, the AI hyperscalers were the largest non-financial corporate buyers of Treasury securities in shorter-duration maturities. In 2020, the net liquidity (cash more than debt) of the hyperscalers (Amazon, Alphabet, Meta, Microsoft, and Oracle) was $209 billion. This has shifted to a net debt amount of $350 billion in 2026. This means that there has been a $500 billion shift in the money markets from those providing capital to those demanding capital. This is the amount that is consolidated on the balance sheets of these companies. We don’t believe this is the total shift, as they have sought out off-balance sheet special purpose vehicle structures to mask the leverage and capital being demanded.
We believe the capital shift is closer to $750 billion – $1 trillion, as the bias we see has been too low by Wall Street and investors in the estimation of what the hyperscalers are willing to do. This would represent a shift of somewhere between 2%-2.5% of all federal debt. Can this be affecting the 10-year Treasury, though? We believe so, as this is less demand in the shorter maturity auctions (two years or less), which puts the yields of the shorter end of the curve in less demand. We think there isn’t much term premium between two- and ten-year maturities for this exact reason.
This pull for capital elsewhere is causing demand to fall off and will continue to compete with the government securities. Estimates are that the US will do roughly 2% of GDP in this capex buildout in 2026, which is roughly $650 billion in capex. One trillion dollars may not be out of the question for 2027. Debt from Microsoft is considered some of the most riskless debt in the corporate world. If a PE firm pitches you a data center project paying you 3% over treasuries with Microsoft as the lessee, how much risk are you taking? It is our belief that this is the kind of logic that is fighting the government issuance market. How can we say that? We also believe that many of these companies are more powerful than most governments of the world, with only the US government being more sovereign. With all the capitalists lobbying for the AI story, it’s no wonder things can get perverse.
It is our opinion that investors are underestimating the power of this demand pull away from riskless Treasury markets to what investors perceive as “riskless” in the private markets with much higher yields. In our opinion, there are a couple of other examples like this. The interest rate of 6% on the 10-year Treasuries in 2000 was of no interest to investors either. In 2007, investors at major wealth management firms were being hocked auction-rate securities as fairly “riskless” places to park shorter-term cash. The market for those securities seized up during 2008, and the investors found out that they were very risky. These rhymes of the past should be haunting the investing public and should be haunting the US government, as they might not be the most interesting entity in the perceived “riskless” yield markets. Claude and Alexa may be getting more likes than Uncle Sam. Uncle Sam might just be realizing that now, and so are his investors!
Play The Long Game,
Cole Smead, CFA
A message from Advisor Perspectives and VettaFi: Discover something new! Click here to register for our upcoming webcasts.
1https://www.federalreserve.gov/econres/notes/feds-notes/how-do-trade-disruptions-affect-inflation-20250228.html (example)
2https://www.pgpf.org/article/the-federal-government-has-borrowed-trillions-but-who-owns-all-that-debt/
The information contained in this missive represents Smead Capital Management’s opinions, and should not be construed as personalized or individualized investment advice and are subject to change. Past performance is no guarantee of future results. Cole Smead, CFA, CEO and Portfolio Manager, wrote this article. It should not be assumed that investing in any securities mentioned above will or will not be profitable. Portfolio composition is subject to change at any time and references to specific securities, industries and sectors in this letter are not recommendations to purchase or sell any particular security. Current and future portfolio holdings are subject to risk. In preparing this document, SCM has relied upon and assumed, without independent verification, the accuracy and completeness of all information available from public sources. A list of all recommendations made by Smead Capital Management within the past twelve-month period is available upon request.
©2026 Smead Capital Management, Inc. All rights reserved.
This Missive and others are available at www.smeadcap.com
© Smead Capital Management
More Wealth Management Topics >