Key takeaways
-
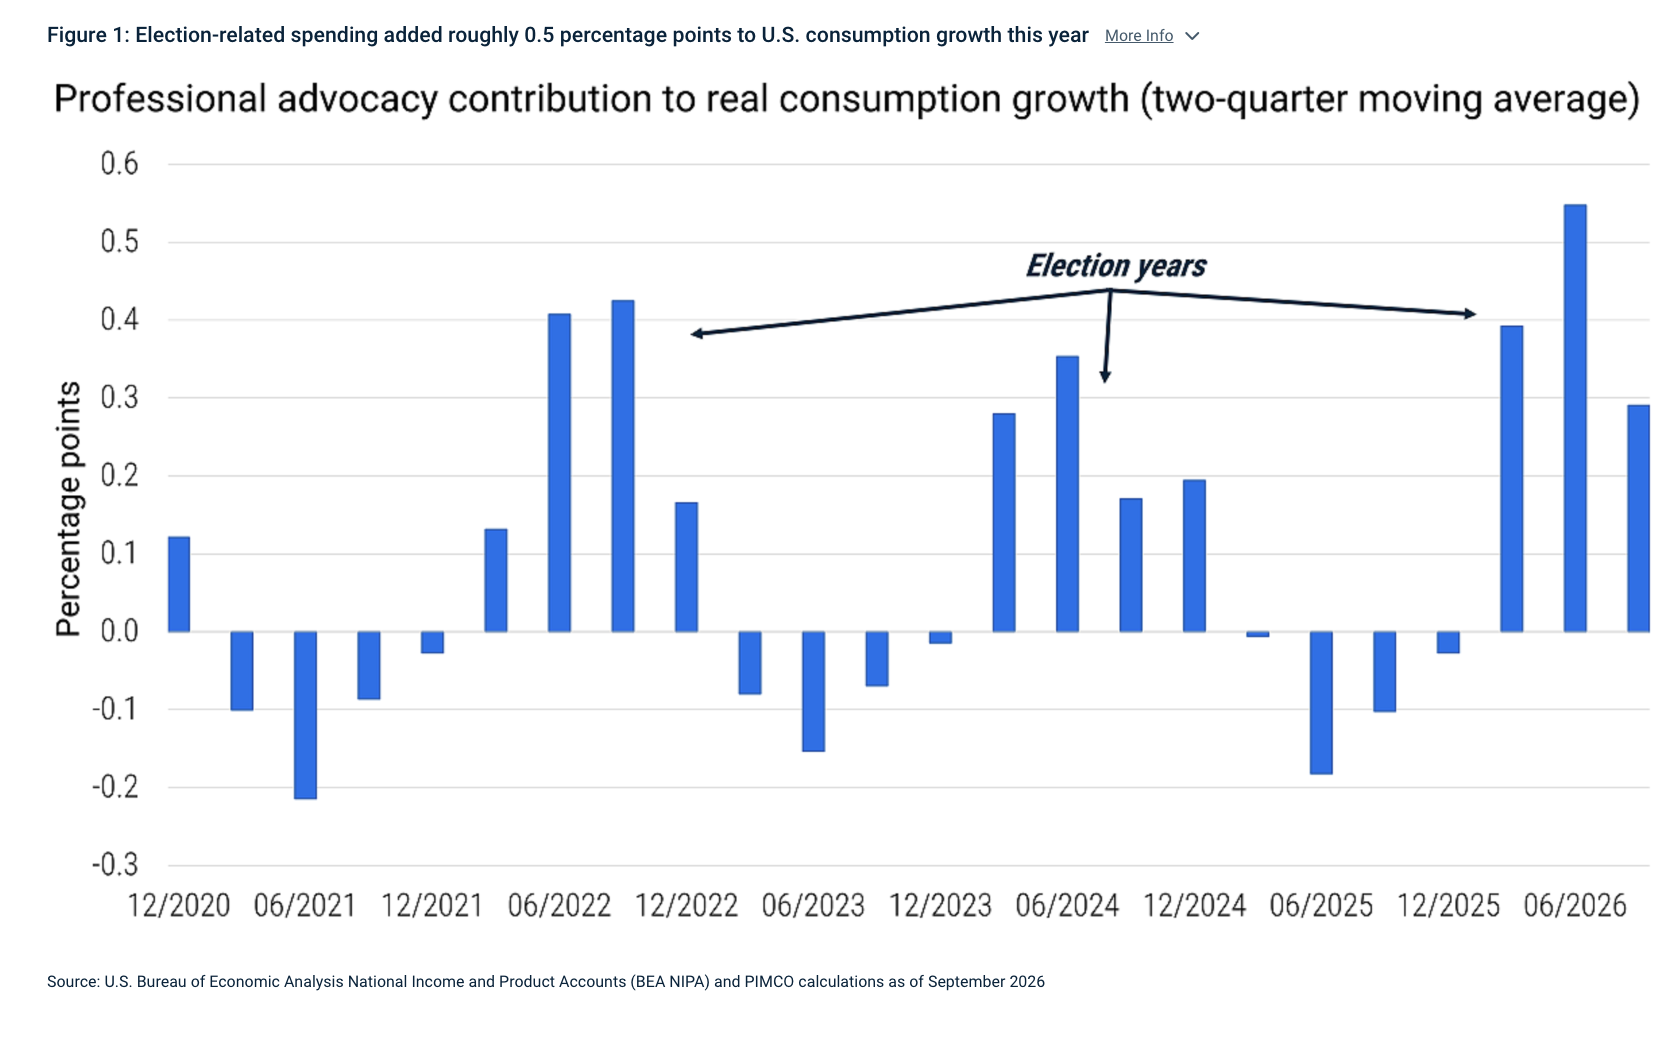
Record midterm election spending gave consumption growth a significant boost. U.S. economic data count a significant portion of political spending as personal consumption expenditures (PCE). That added roughly 50 basis points to real consumption growth through the first three quarters of 2026 – enough to offset some of the drag from higher energy prices.
-
Retroactive tax provisions also put cash in household pockets. New or enhanced deductions from the One Big Beautiful Bill Act (OBBBA) reached many households as larger refunds or smaller tax bills during the 2026 filing season. We estimate these provisions added roughly $160 billion to what households had available to spend this year.
-
Consumer resilience in 2027 is far less certain. With election outlays and larger tax refunds both fading after the midterms, the outlook for U.S. consumers depends more heavily on energy prices.
Following the U.S. midterm elections, investors will naturally focus on what the results mean for fiscal policy, geopolitics, and the regulatory outlook. But there’s another more immediate way the midterms have already mattered for the economy: The campaigns themselves have provided a meaningful boost to U.S. growth.
Unprecedented election spending, plus retroactive household tax cuts, help explain why U.S. consumption has been resilient in 2026 in the face of 40% higher household energy prices – something that would normally be a substantial headwind on real spending.
Looking ahead to 2027, however, election-related spending will fall sharply, and the one-time boost from larger tax refunds will not repeat. The outlook for continued consumer resilience, therefore, may increasingly depend on whether higher energy prices reverse.
See more: Will the Bond Market Retire the French Pension?
Untangling the puzzle of resilient U.S. consumption
One of the biggest puzzles of 2026 has been the resilience of the U.S. consumer in the face of what has been a substantial increase in energy prices. Higher spending from wealthy households, who have enjoyed several years of strong equity gains, is one plausible explanation for some of the resilience. However, a detailed look at the National Income and Product Accounts (NIPA) data from the U.S. Bureau of Economic Analysis (BEA) reveals a much simpler accounting: Unprecedented political campaign spending was an offset to the impact of energy costs.
Higher energy prices are a headwind for households. In a typical economy, households cannot easily substitute away from the gasoline and other energy products needed to power their cars and heat their homes. Although the rise of work-from-home arrangements, electric vehicles, solar power, and other energy-saving products have reduced the dependence on energy over time, higher energy prices still act much like a tax on consumption for most households.
The shale revolution in the mid-2010s and the rise of U.S. energy production, which turned the U.S. into a net energy producer and exporter, hasn’t fully mitigated the impact. Higher energy prices effectively shift real income from households toward the owners of energy-producing companies. Most households are not participating enough in energy sector gains (via investments, for example) to offset the direct hit to their purchasing power.
Simple accounting gives us a sense of the magnitude of the increasing energy “tax.” Gasoline and other energy goods prices have risen roughly 40% this year, according to the U.S. Consumer Price Index. Energy goods account for around 3% of consumer spending, according to the BEA. Assuming households don’t reduce consumption of energy goods in reaction to higher prices, a 40% increase in prices therefore must result mathematically in a 1.2-percentage-point (ppt) decline in household spending elsewhere. Even if consumers absorb half of the shock by saving less of their income or dipping into accumulated savings, the implied drag on real consumption growth is still 0.6 ppt – an estimate that is consistent with the findings of empirical studies.
There is surprisingly little evidence of that kind of drag in the aggregate data, however. Through the first three quarters of 2026, U.S. real consumption grew at roughly a 2.75% annualized pace – a similar pace as in 2025, when energy prices were far lower.
What has supported the consumer amid this year’s energy shock? The reported saving rate has indeed declined, suggesting that strong U.S. equity returns may also have reduced households’ perceived need to save at the same rate.
But a detailed look at the BEA data unveils another major factor. In particular, the election-driven increase in professional advocacy spending reportedly boosted real consumption growth by roughly 0.5 ppts on average over the first three quarters of the year (see Figure 1) – effectively offsetting the energy drag.
Yes, political ads count as consumption
Political spending has grown substantially over the past decade and a half, following legal changes (most notably the Supreme Court’s 2010 Citizens United decision) that expanded the scope for corporations, unions, and other organizations to make independent political expenditures.
Political campaign activity is recorded in the NIPAs as personal consumption expenditures (PCE), and since the pandemic in particular, it has become a substantial impulse to overall growth in election years. The logic for including this activity in the consumption data is that these organizations ultimately provide services to households rather than producing goods or services for sale in the traditional sense.
In the NIPA framework, the “persons” in PCE encompass both households and nonprofit institutions serving households. This accounting recognizes that a nonprofit can provide a final service to households even when households do not purchase the service directly at a market price. Think, for example, of a food bank or free health clinic. The BEA measures the consumption of these nonprofits largely as the cost of providing their services, including compensation and purchases of goods and services, net of receipts from sales to households.
That accounting treatment matters for elections because political organizations are also categorized within that nonprofit sector serving households. Their spending on political advocacy is recorded as the production and consumption of a final service on behalf of households.
In other words, whether a household prefers to watch political campaign ads or not, NIPA records the resulting advocacy service as “consumed.”
Election-related spending has steadily grown since 2010. However, an unusually competitive political landscape helped turn 2026 into the most expensive midterm election on record. Campaign finance watchdogs estimate that candidates, political parties, political action committees, and outside groups spent nearly $12 billion on federal elections alone, up from $8.9 billion during the 2022 midterms. And that figure does not include state and local election activity. State ballot-measure campaigns alone attracted roughly $1.25 billion in contributions by early November, while tight gubernatorial races – with campaigns focused on anti-AI policies and slowing data center investment – also saw significant spending.
Using the NIPA data, our calculations suggest that nominal spending on professional advocacy services in the first three quarters of 2026 outpaced the annualized 2025 rate by roughly $22 billion. Not all of it represents campaign spending, of course. The category is broader, and some of the increase would have occurred regardless of the election. But the timing and magnitude are striking.
The source of the money is important as well. Political campaigns are disproportionately financed by wealthy and ultrawealthy households. In the 2024 election, estimates suggest that billionaires and their families alone accounted for nearly one-fifth of reported federal political contributions. Academic research has similarly documented the increasing concentration of campaign contributions among a very small group of extremely wealthy donors.
Campaign contributions also likely explain at least part of the substantial decline in the measured household saving rate this year. To the extent that these contributions are financed from income or wealth that otherwise would have been saved, campaign activity effectively transfers resources from high-saving households to political organizations that rapidly spend those funds on advertising, consultants, staff, travel, and events.
The composition of advertising spending also matters for measured growth. When a private company buys advertising, GDP doesn’t count it as a separate purchase: The ad is treated as a cost of doing business, like electricity or raw materials, and its price is built into whatever the company sells. Counting both the ad and the final product would count the same spending twice. Political organizations are different. When a nonprofit political organization purchases advertising and other inputs to provide advocacy services to households, the resulting final nonprofit service is recorded as consumption.
A temporary shift in advertising demand from businesses toward political organizations can therefore raise measured final consumption and GDP.
Tax changes also provided indirect support to consumption
Campaign spending wasn’t the only thing that temporarily boosted consumption this year. The one-time household tax windfall from the One Big Beautiful Bill Act (OBBBA) also likely supported U.S. consumption indirectly in 2026. The legislation enacted several new or enhanced household tax provisions with retroactive effects, including the higher state and local tax deduction cap, deductions for tips and overtime, and the enhanced deduction for seniors. Because some of the provisions applied to 2025 income but were enacted after withholding schedules had already been established, part of the tax relief reached households through larger refunds and lower final tax payments during the 2026 filing season.
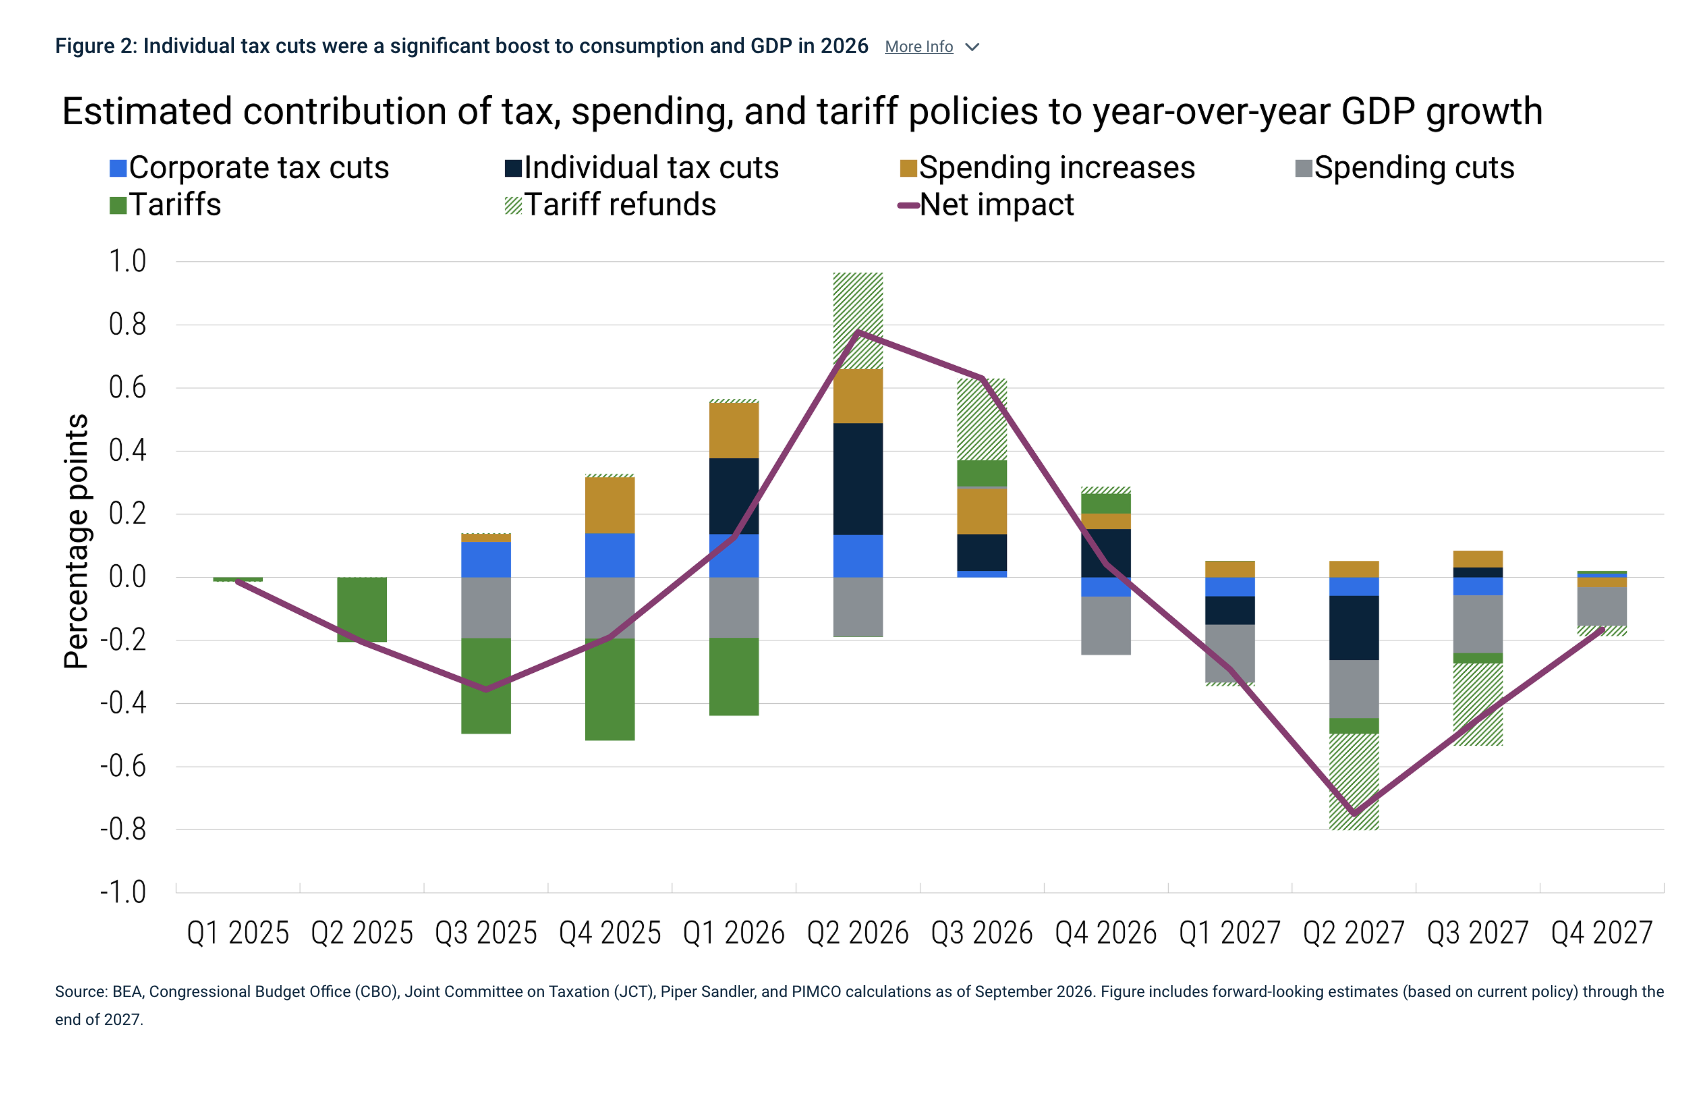
We estimate that these provisions boosted U.S. household cash flow by roughly $160 billion in calendar year 2026. (Our calculations focus on the new or enhanced household provisions, not simply the extension of the existing tax regime.) That significant, albeit temporary, boost also helped consumers maintain spending in the face of higher energy prices.
Figure 2 provides our estimates of the growth impact of the Trump administration’s tax, spending, and tariff policies, using Congressional Budget Office (CBO) estimates of the impacts of various government activities. Individual tax cuts were likely a significant contributor to GDP in early 2026.
Energy headwinds delayed?
Higher energy prices should have imposed a substantial headwind on household consumption. But that shock coincided with two unusually large offsets: an election-related surge in nonprofit consumption and a tax-law-induced boost to household cash flow. So perhaps it is not so surprising that consumption growth has remained resilient at around 2.5% year-over-year.
The more important question is what happens next. Election spending will fall sharply, and the one-time tax-refund boost will fade. That leaves energy prices as an increasingly important swing factor for the consumer in 2027. If energy prices retrace toward pre-conflict levels, the resulting improvement in household real incomes should offset some of the disappearing policy support. If they don’t, the drag from higher energy costs may finally become visible in aggregate consumption growth.
In other words, one-time factors likely delayed the visible impact of higher energy prices on consumption. We expect that higher energy prices will eventually start to bite.
Disclosures
A word about risk: All investments contain risk and may lose value.
Statements concerning financial market trends or portfolio strategies are based on current market conditions, which will fluctuate. There is no guarantee that these investment strategies will work under all market conditions or are appropriate for all investors and each investor should evaluate their ability to invest for the long term, especially during periods of downturn in the market. Outlook and strategies are subject to change without notice.
PIMCO as a general matter provides services to qualified institutions, financial intermediaries and institutional investors. Individual investors should contact their own financial professional to determine the most appropriate investment options for their financial situation. This material contains the opinions of the manager and such opinions are subject to change without notice. This material has been distributed for informational purposes only and should not be considered as investment advice or a recommendation of any particular security, strategy or investment product. Information contained herein has been obtained from sources believed to be reliable, but not guaranteed. No part of this material may be reproduced in any form, or referred to in any other publication, without express written permission. PIMCO is a trademark of Allianz Asset Management of America LLC in the United States and throughout the world.
CMR2026-1104- 6087636
A message from Advisor Perspectives and VettaFi: Discover something new! Click here to register for our upcoming webcasts.
© PIMCO
More Energy Topics >