Spinning Wheel: What Goes Up…
Membership required
Membership is now required to use this feature. To learn more:
View Membership Benefits
Key takeaways

- Year to date, major equity indexes are sitting on double-digit gains and relatively tame maximum drawdowns, which gives the illusion that the market has been in a relatively calm state.
- Intense churn and rotation under the surface underscore that we are increasingly seeing a market of stocks as opposed to a stock market, which is not without potential opportunity.
- Dispersion is also evident in gross domestic product (GDP) data so far this year, as technology's and net exports' contributions are near record territory.
Notwithstanding that the major U.S. equity indexes are sitting on healthy double-digit gains heading into the final two months of 2026, the calm at the index level belies a lot of churn and rotation underneath.
See more: Calm on the Surface, Steady as She Goes?
Average index members have suffered drawdowns two to nearly four times larger than their parent indexes, stock level correlations are at or near their lowest readings in more than a decade, and sector leadership has been flipping month to month. At the same time, earnings and forward estimates have been moving up rather than down, which is not the norm.
In short, this has been a market of stocks rather than a stock market. Let's walk through the data on drawdowns, breadth, correlations, rotations, earnings revisions, and economic growth, and what it all might mean for investors.
Index gains mask member-level pain/churn
As shown below, through the end of October, the S&P 500 is up 11% year to date, with a maximum drawdown of only -9%—less than a "correction"-level decline. However, the average member of the index has suffered a maximum drawdown of -27%. The story is similar across the board for other equity indexes, but it's most extreme for the Nasdaq, where the index's maximum drawdown of -13% was swamped by the average member's whopping -48% drawdown.
Diversified? Tax efficient? Cost effective?
Drawdowns are more severe at constituent level
Major indexes and maximum drawdowns
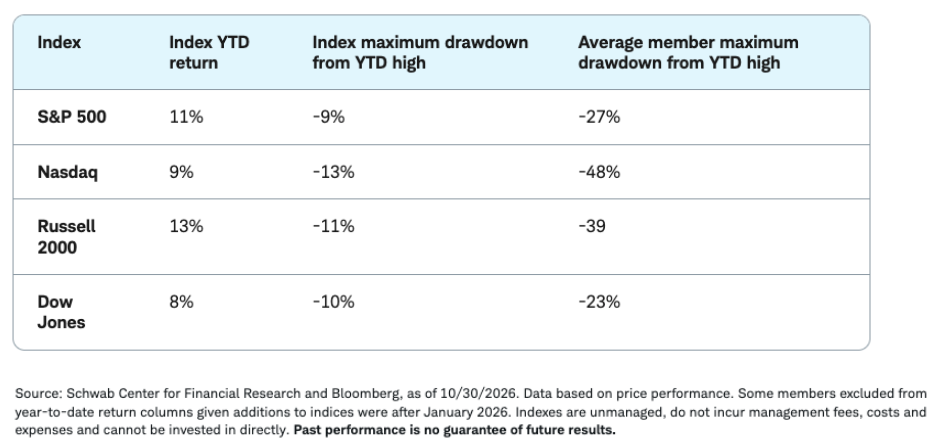
The gap between index and member drawdowns is a tell. The capitalization-weighted indexes have been held aloft by whichever group or sector has been leading at the time, while a large share of individual stocks have gone through what has amounted to their own bear markets. Index-level returns tell very little about the experience of the typical stock, or of an investor who owns a concentrated handful of them.
Correlations are scraping the floor
As shown below, the rolling three-month correlation among S&P 500 members has fallen to almost zero, which is near the bottom of its range going back to 2011. Stocks are trading on their own fundamentals and narratives, rather than moving together as a herd.
Stocks marching to beat of individual drummers
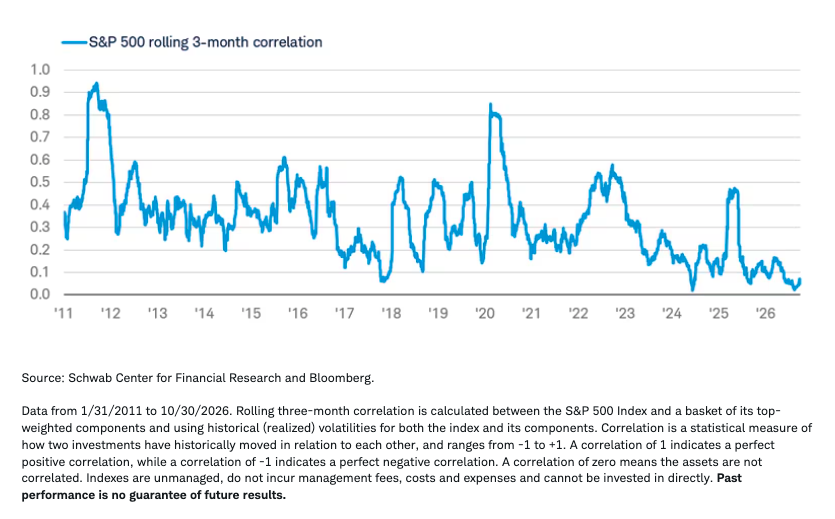
For context, correlations tend to spike during periods of macro stress, when everything gets sold at once. That happened in the 2011 debt ceiling and eurozone crisis episode (when correlations were above 0.9), the 2020 pandemic crash (above 0.8), the 2022 inflation spike/bear market (near 0.6), and, to a lesser degree, the spring 2025 tariff shock (near 0.5). Each spike was followed by a long grind lower.
The trend since 2023 has been decidedly downward, with readings mostly below 0.2 and now near the lows. Low correlation is a double-edged sword. It arguably reflects a market not gripped by fear and one that rewards security selection. But it also means diversification across a few big names is not doing the work investors might assume based on history. It's also suggestive of a backdrop where index stability can coexist with sharp swings in individual stocks.
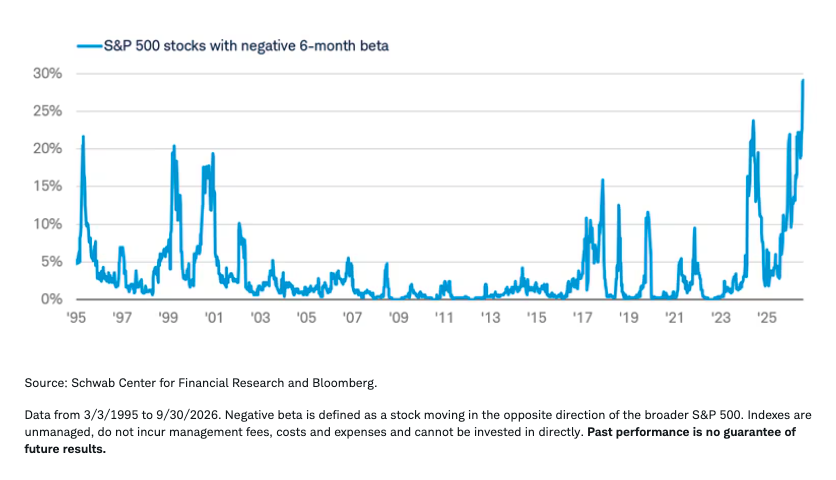
Another example of this phenomenon is the fact that a record share of the S&P 500 has been trading with a negative six-month beta, meaning the stocks have been moving in the opposite direction of the index on a weekly basis.
Index one way, stocks another
Breadth: from narrow to broad(er) in a matter of weeks
As shown below, the share of S&P 500 members outperforming the index over the trailing month surged to about 70% at the end of October, from only 17% a few weeks earlier, according to Bloomberg. The latest reading is near the top of the range seen since 2022.
Less market halitosis
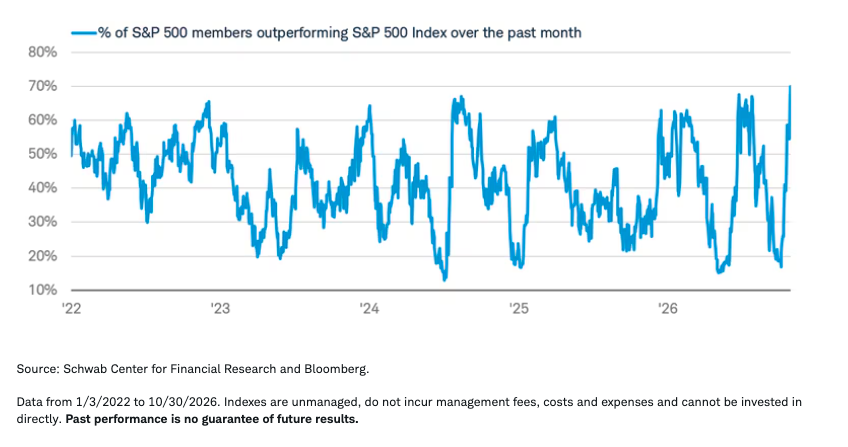
What stands out about 2026 is the amplitude of the swings. The measure fell to about 15% in the spring, jumped to roughly 67% in the summer, collapsed back below 20% in early fall, and has now spiked again. These whipsaws are the breadth equivalent of the low-correlation backdrop: leadership is rotating rapidly rather than settling into a durable trend.
Sectors are playing musical chairs
In October, the S&P 500 fell back nearly 1%, yet eight of 11 sectors gained at least 3.9%, according to Bloomberg. The index was dragged lower by former darlings Communication Services and Information Technology (home to many of the index's largest companies), while Energy, Consumer Staples, Utilities, and Health Care all posted a strong month.
Leadership inconsistency
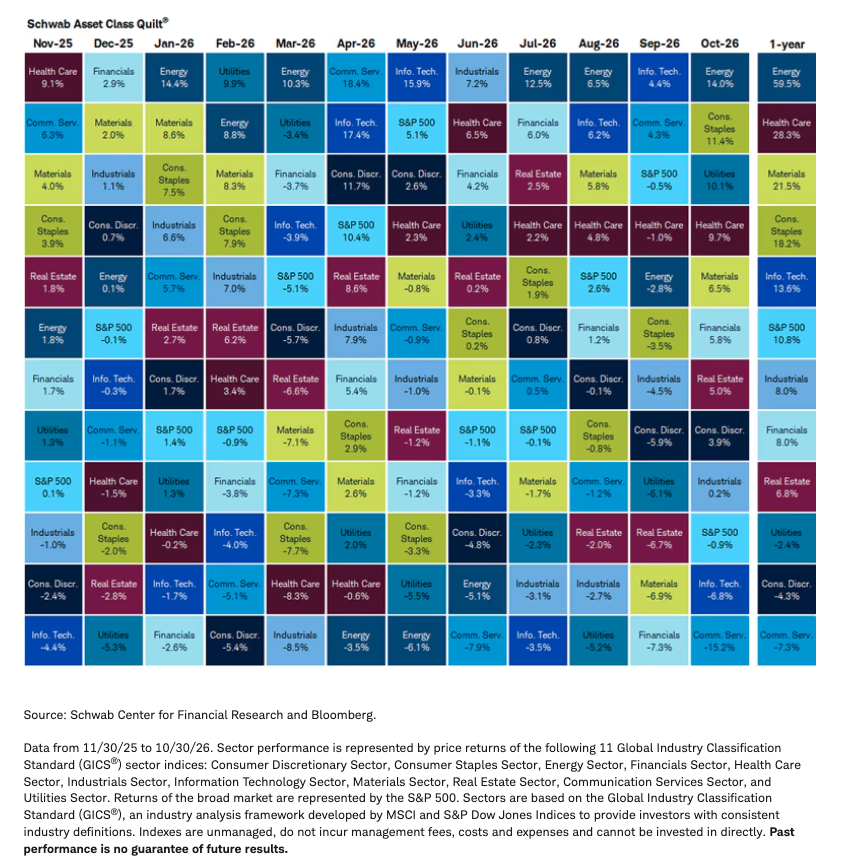
Looking back over the past year, the monthly sector quilt shows how little persistence there has been in leadership. Energy was the top sector in five of the past 12 months, but it was dead last in April and May, and near the bottom in June. Communication Services led in April, but finished last in both June and October. Tech has bounced between the top and bottom of the rankings all year.
Top sectors moving in opposite directions
Perhaps the most striking illustration of this year's dispersion: as of October 28, when Energy and Tech were the top two best sector performers within the S&P 500, the correlation between them was negative. That is the first negative reading in Ned Davis Research's data going back to at least 1973.
Energy and Tech diverged significantly
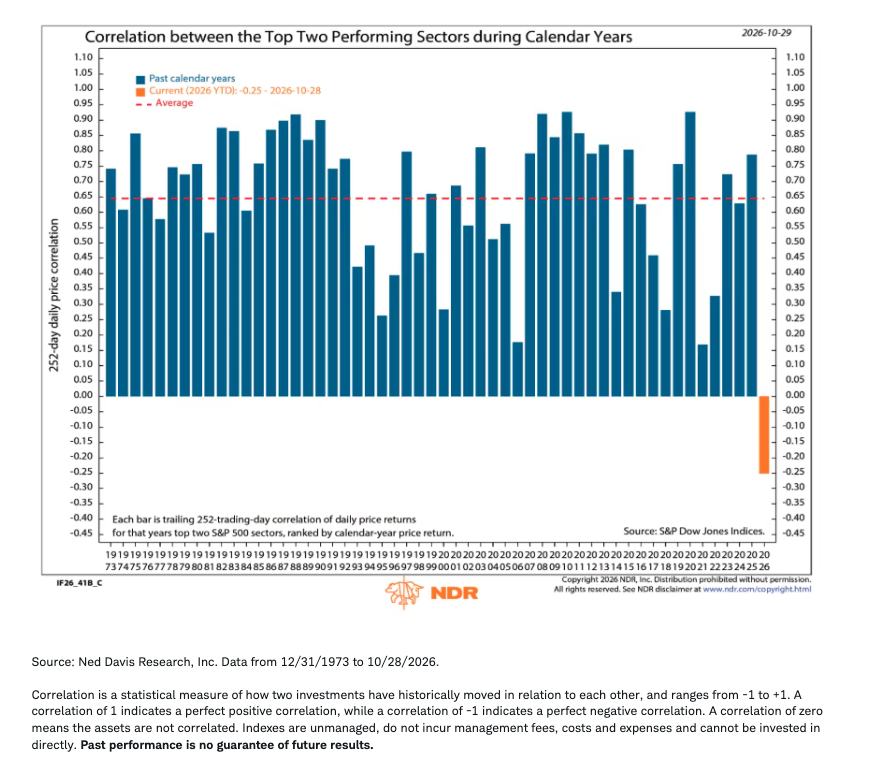
The Health Care sector has now leapfrogged Tech to move into the second spot, so history may be less of a guide. However, historically, the year's two leading sectors tended to move together, with an average correlation of about 0.65, as they are usually riding similar macro waves. This year, Energy and Tech have effectively been taking turns, which shows that leadership has not come from a single theme (and that goes for Health Care, too). It is a meaningful departure from the narrow, momentum-driven leadership of recent years.
For our ratings on all 11 S&P 500 sectors, see the latest Schwab Sector Views.
Earnings breadth across sectors
We are in the throes of third-quarter earnings season and so far so good, although not without bumps along the way. As shown below, the estimated year-over-year earnings growth rate for the S&P 500 in the third quarter now sits at 32%, up from less than 28% at the start of July. That four-point increase runs against the typical pattern, in which analysts trim estimates as a quarter unfolds, allowing companies to "beat" a lowered bar. That trend has been bucked so far this year.
Riding an upward 3Q26 earnings estimate wave
3Q 2026 estimated earnings growth rate (y/y)
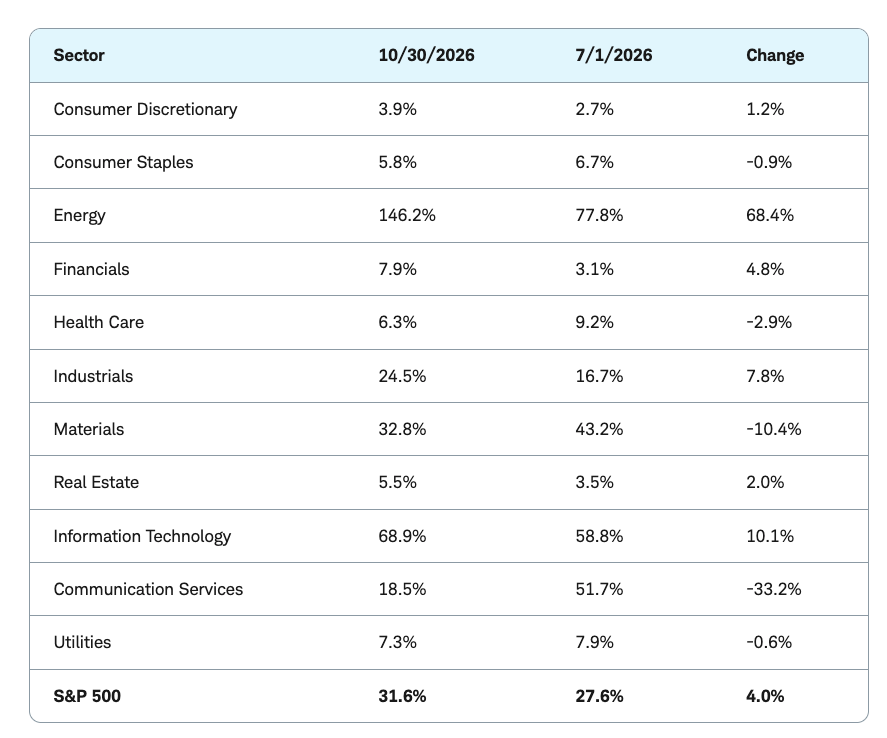

The largest upgrades have been to the Energy, Industrials, and Financials sectors, while the largest downgrades have been to Communication Services, Materials, and Health Care. The Communication Services' cut lines up with that sector's October drubbing in price. Technology is a more interesting case: estimates were raised by 10 points even as the sector fell nearly 7% in October, suggesting at least part of the recent weakness is about positioning and valuation rather than fundamentals.
For calendar year 2026, estimated S&P 500 earnings growth has jumped to 36% from less than 27% on July 1, an upward revision of nearly 10 points in four months. Ten of 11 sectors saw estimates rise or hold steady.
Riding an upward FY26 earnings estimate wave
2026 estimated earnings growth rate (y/y)
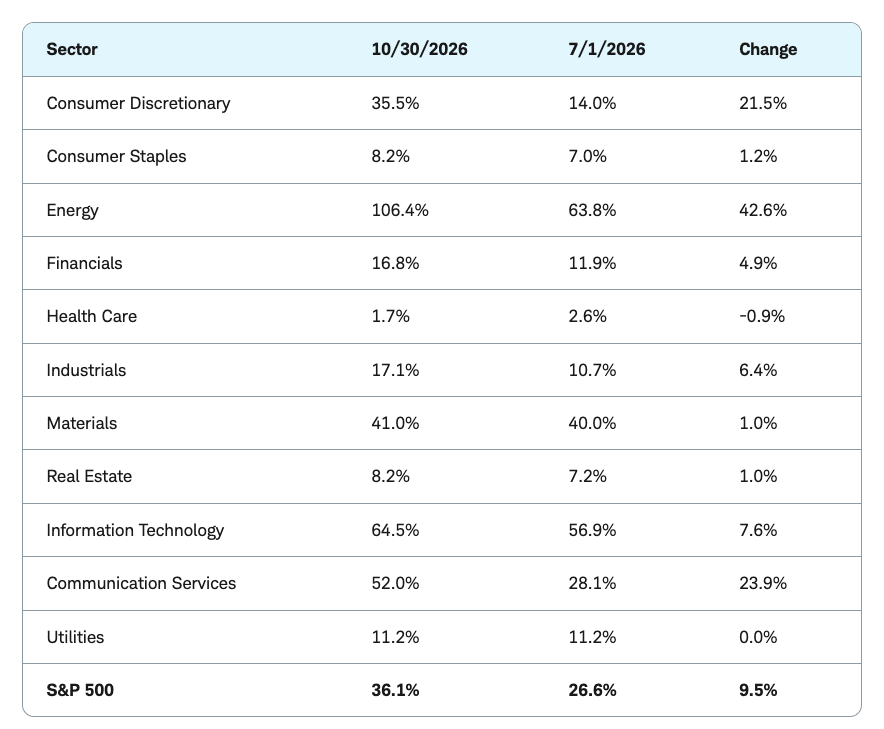

Energy again leads the full-year growth expectation, followed by Communication Services and Consumer Discretionary. Health Care is the lone sector with a cut. Two disconnects are worth flagging. Communication Services' full-year estimates are up 24 points, yet third-quarter estimates were slashed by 33 percentage points, and the sector is down more than 7% over the past year. The full-year number appears to be leaning on results outside the third quarter, while the market appears skeptical of its durability. Health Care has the weakest expected 2026 earnings growth of the 11 sectors, yet it is the second-best performer over the past year—the gain likely coming from multiple expansion and defensive (risk-off) demand.
Small caps: quality is winning
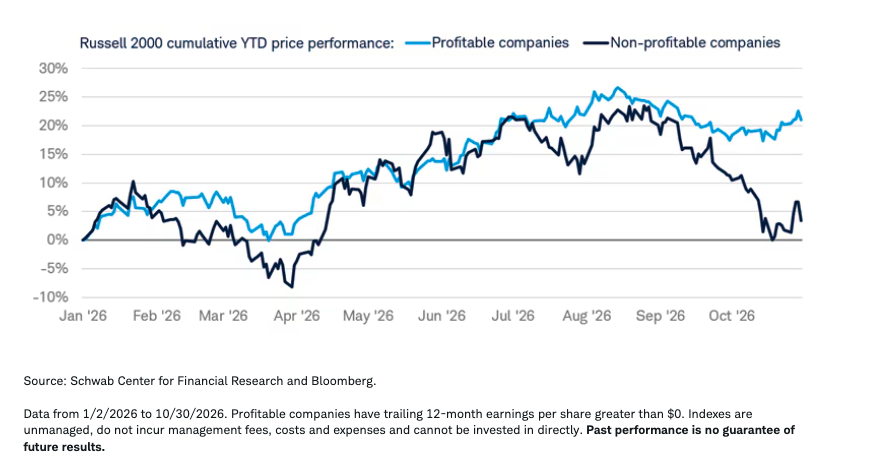
In an environment where dispersion at the sector level is partly driven by widening earnings outlooks, an interesting divide has opened up within the Russell 2000 Index of small cap stocks. Unlike last year, when non-profitable small caps outperformed profitable ones by nearly two-to-one, this year it's the opposite story, as shown below. Profitable stocks are up more than 20% year to date (handily outperforming the S&P 500), while non-profitable stocks are up only 3%. This is consistent with the member-level drawdown data: the Russell 2000's average member has suffered a maximum drawdown of 39% this year, with the damage concentrated in the lower-quality, more speculative end of the index.
Profitability reigns this year
Economics and markets rhyming
While it is not always the case that the stock market is the economy, they can certainly rhyme at times. That is very much true if we look at the record dispersion we are seeing in some components of U.S. GDP, which expanded at an impressive 3.4% (quarter-over-quarter annualized) in the third quarter. Unsurprisingly, private sector investment remained a key source of power for growth, but the influence of technology has grown immensely.
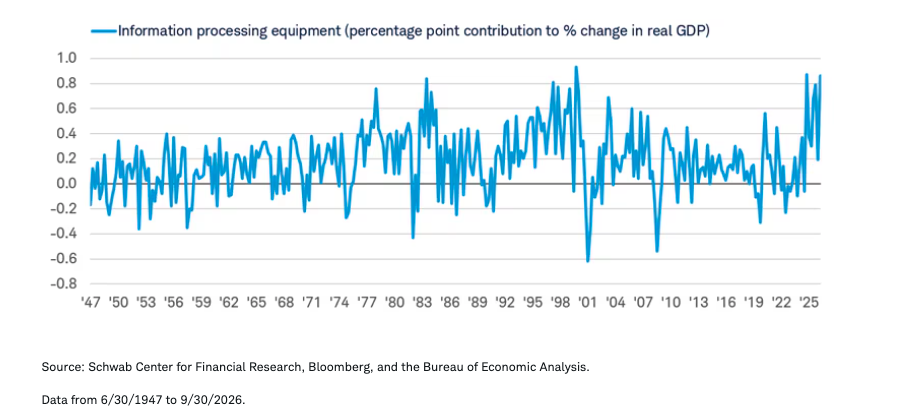
As shown below, information processing equipment's contribution to real GDP totaled 0.86 percentage points. The only other times with a larger contribution were in the first quarter of 2025 and the first quarter of 2000. Of course, the latter elicits some discomfort given it marked the peak of the market cycle and the coming peak in the economy later in 2001. It's premature to judge whether the market is on a similar path, but while cycles can rhyme, they are often played in different keys.
Near-record tech dominance
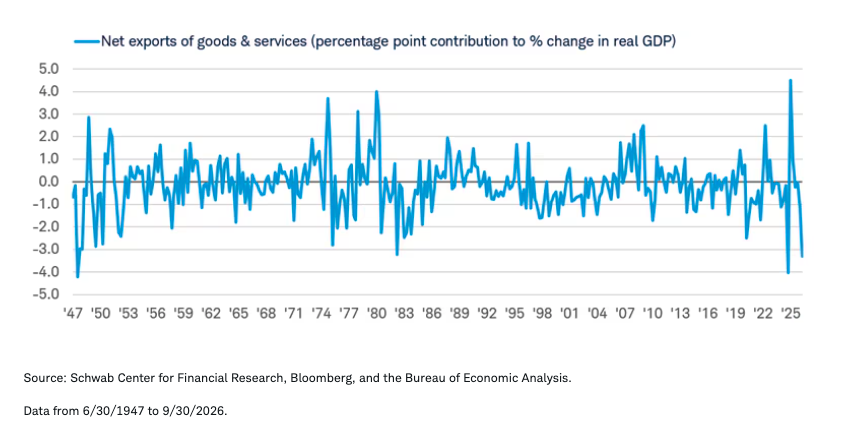
As such, the current cycle is being distorted by the fact that the artificial intelligence (AI)-driven tech boom—unlike the tech boom in the late 1990s—is overwhelmingly dependent on imports. To be sure, net export activity pulled down growth for much of the internet boom in the 1990s (as is the case today), but the current pace of imports is on a scale we've rarely seen in history. As shown in the chart below, net exports subtracted 3.32 percentage points from GDP in the third quarter. Excluding the Liberation Day swings, one has to go back to the 1940s (nearly the start of GDP data) to see a similar magnitude.
Import swings are historic
This underscores an important reminder when it comes to the math of the AI boom. The United States' position as a net importer—especially in the information technology category—has not changed. If anything, dependence on foreigners has increased, evidenced by the fact that semiconductor imports are up by 185% year over year through August, according to the U.S. Census Bureau. We are on record for calling today's stock market a "duck" this year, which looks calm on the surface but is quite chaotic underneath. Perhaps the same can be said of the economy, thanks to the distortions coming from AI's outsized influence on business investment, as well as its import bias.
In sum
The headline indexes paint a picture of a steady, comfortable year. Underneath, it has been anything but, with deep drawdowns for the average stock, near-record low correlations, whipsawing breadth, and rotating sector leadership. Supporting it all is an earnings backdrop that has improved meaningfully since mid-year, although the gains are unevenly distributed across sectors. That uneven distribution is also being reflected in the country's growth profile, where consumers look to be under increasing pressure (again) from hotter inflation while business investment largely continues to ignore the increase in rates.
For investors, there are a few implications:
- Don't judge your portfolio by cap-weighted indexes;
- Diversification and rebalancing are especially important right now;
- Favor quality, especially if looking for opportunities in small caps; and
- Understand AI's unique influence on the economy.
A message from Advisor Perspectives and VettaFi: Discover something new! Click here to register for our upcoming webcasts.
This material is intended for general informational and educational purposes only. This should not be considered an individualized recommendation or personalized investment advice. The investment strategies mentioned are not suitable for everyone. Each investor needs to review an investment strategy for his or her own particular situation before making any investment decisions.
All expressions of opinion are subject to change without notice in reaction to shifting market, economic or political conditions. Data contained herein from third party providers is obtained from what are considered reliable sources. However, its accuracy, completeness or reliability cannot be guaranteed.
Past performance is no guarantee of future results.
Investing involves risk, including loss of principal.
Performance may be affected by risks associated with non-diversification, including investments in specific countries or sectors. Additional risks may also include, but are not limited to, investments in foreign securities, especially emerging markets, real estate investment trusts (REITs), fixed income, and small capitalization securities and commodities. Each individual investor should consider these risks carefully before investing in a particular security or strategy.
All corporate names and market data shown are for illustrative purposes only and are not a recommendation, offer to sell, or a solicitation of an offer to buy any security.
Diversification, asset allocation and rebalancing strategies do not ensure a profit and do not protect against losses in declining markets.
Rebalancing may cause investors to incur transaction costs and, when a non-retirement account is rebalanced, taxable events may be created that may affect your tax liability.
The policy analysis provided by the Charles Schwab & Co., Inc., does not constitute and should not be interpreted as an endorsement of any political party.
Small-cap investments are subject to greater volatility than those in other asset categories.
Indexes are unmanaged, do not incur management fees, costs, and expenses and cannot be invested in directly. For more information on indexes, please see schwab.com/indexdefinitions.
Sector and/or industry weightings for the portfolio are determined using the Global Industry Classification Standard (GICS®). Global Industry Classification Standard (GICS®) was developed by and is the exclusive property of MSCI Inc. (MSCI) and Standard & Poor's (S&P). GICS is a service mark of MSCI and S&P and has been licensed for use by Charles Schwab & Co, Inc.
The Schwab Center for Financial Research is a division of Charles Schwab & Co., Inc.
Source: Bloomberg Index Services Limited. BLOOMBERG® is a trademark and service mark of Bloomberg Finance L.P. and its affiliates (collectively "Bloomberg"). Bloomberg or Bloomberg's licensors own all proprietary rights in the Bloomberg Indices. Neither Bloomberg nor Bloomberg's licensors approves or endorses this material, or guarantees the accuracy or completeness of any information herein, or makes any warranty, express or implied, as to the results to be obtained therefrom and, to the maximum extent allowed by law, neither shall have any liability or responsibility for injury or damages arising in connection therewith.
The Charles Schwab Corporation provides a full range of brokerage, banking and financial advisory services through its operating subsidiaries. Its broker-dealer subsidiary, Charles Schwab & Co., Inc. (member SIPC), and its affiliates offer investment services and products. Its banking subsidiary, Charles Schwab Bank, SSB (member FDIC and an Equal Housing Lender) provides deposit and lending services and products. Its banking subsidiary, Charles Schwab Premier Bank, SSB (member FDIC) provides cryptocurrency services and products.
This site is designed for U.S. residents. Non-U.S. residents are subject to country-specific restrictions. Learn more about our services for non-U.S. residents, Charles Schwab Hong Kong clients, Charles Schwab U.K. clients.
© 2026 Charles Schwab & Co., Inc. All rights reserved. Member SIPC. Unauthorized access is prohibited. Usage will be monitored.
Membership required
Membership is now required to use this feature. To learn more:
View Membership Benefits