Key takeaways
- Rising concentration and overlapping holdings across styles can leave seemingly diversified portfolios dependent on the same handful of mega-cap companies.
- In our view, genuine diversification requires looking at the underlying companies, position sizes and shared investment themes across an entire portfolio.
- Deliberate security selection and limits on company and thematic exposure can enable active managers to provide the breadth that concentrated benchmarks and the passive vehicles that track them increasingly lack.
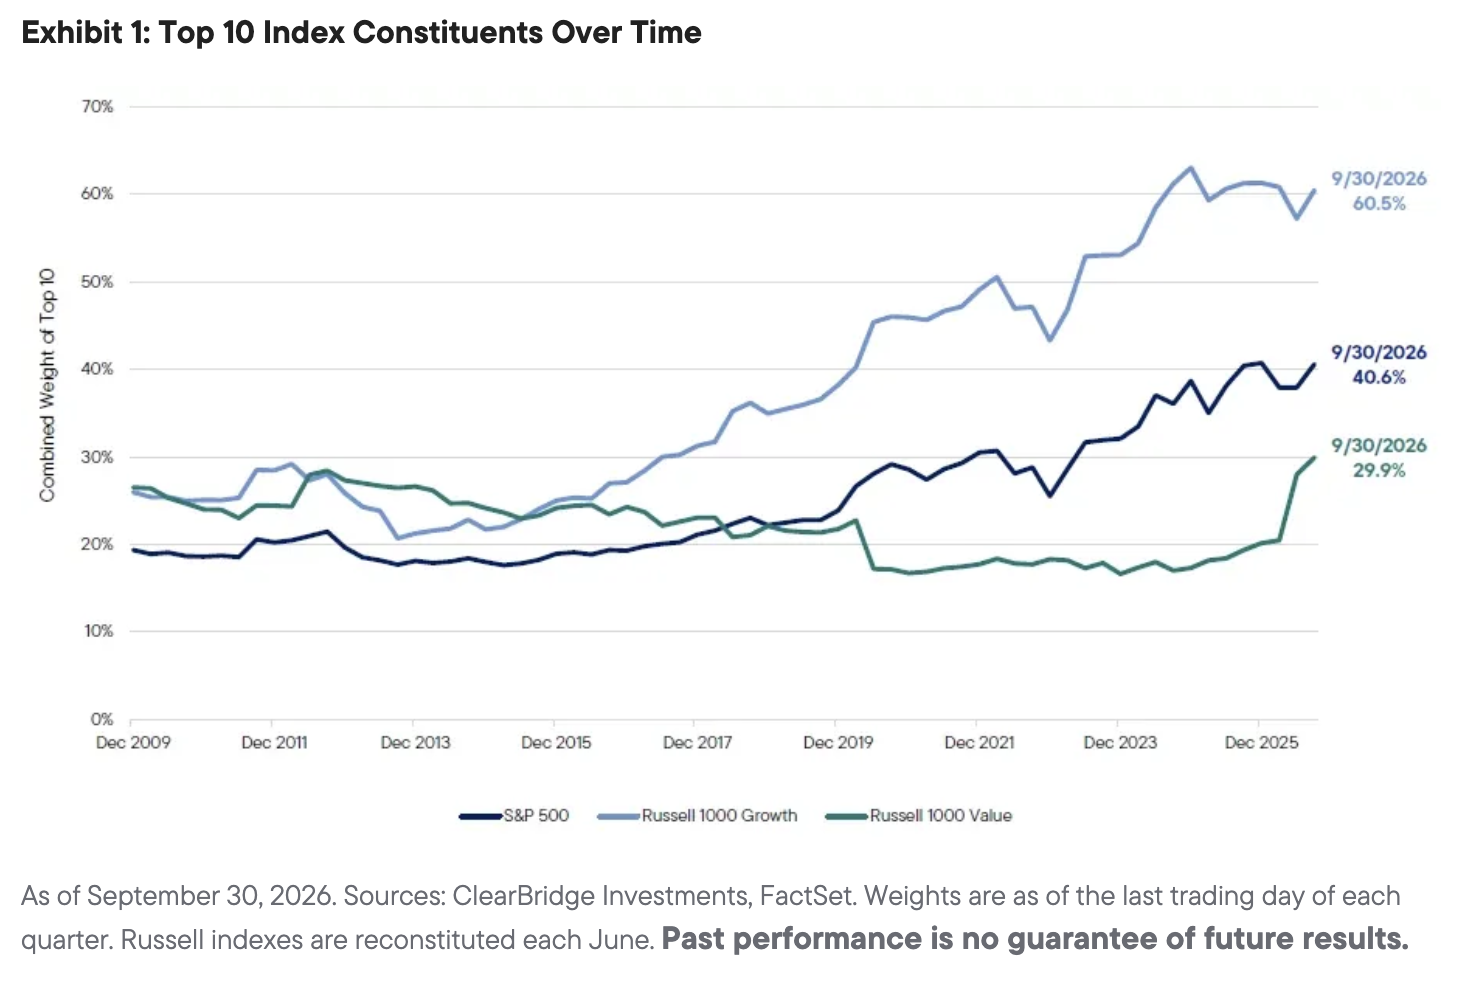
Over the last three decades, investors have gravitated toward passive investment products for broad equity market exposure. Active products have been used as supplements, to express a deliberate view or obtain idiosyncratic exposure. This approach rests on the assumption that the passive index products are diversified; that is no longer the case. The S&P 500 Index, the Russell 1000 Growth Index and the Russell 1000 Value Index—among the most widely used benchmarks in the United States—have all become concentrated (Exhibit 1). Moreover, the indexes no longer look different, they have converged on the same companies.
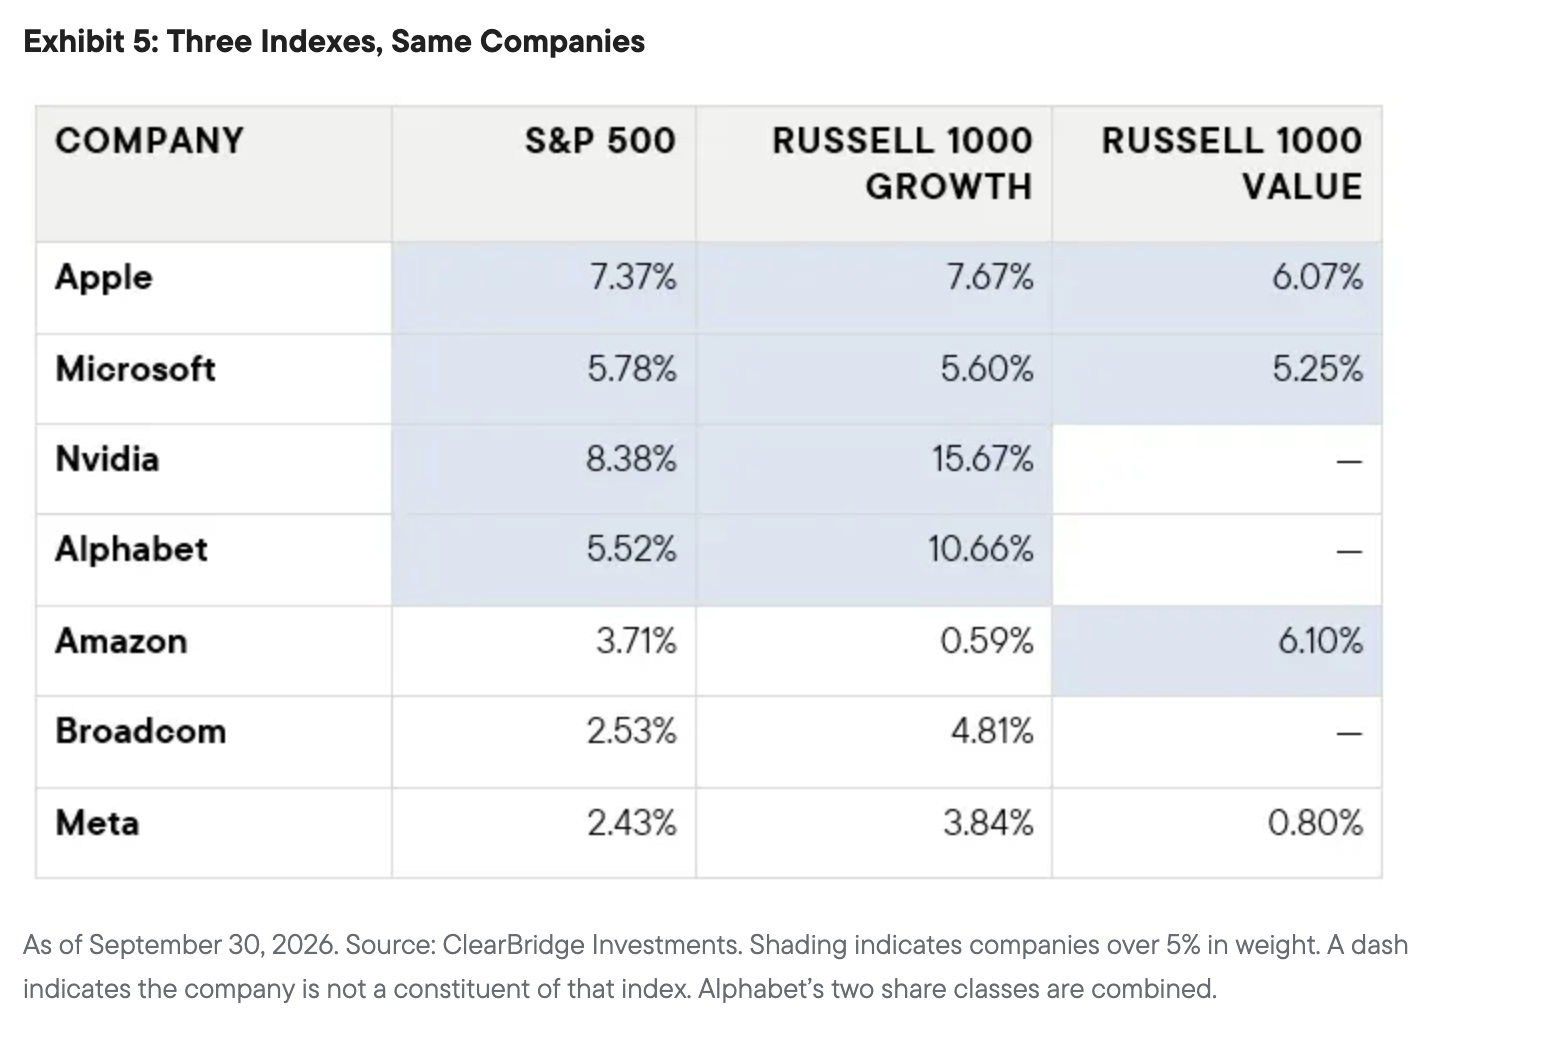
Because success breeds complacency, and because the markets have done so well for so long, most investors seem to be overlooking this risk. Allocating 50% to the S&P 500, 30% to the Russell 1000 Growth and 20% to the Russell 1000 Value, for example, yields a portfolio where just five companies tied to the single theme of artificial intelligence (AI)—Nvidia, Apple, Alphabet, Microsoft and Amazon—represent 31% of the total portfolio.
See more: How to Build a Bond Portfolio
Index Investing Ain’t What It Used To Be
The S&P 500 Index is the archetype for a broad market index. Yet four companies—Nvidia, Apple, Microsoft and Alphabet—now account for 27% of the benchmark. It takes just 20 companies to account for half the index weight by market cap.1 Nvidia, on its own, is larger than the energy, utilities and real estate sectors combined; Nvidia, Apple and Microsoft together outweigh six of the index’s 11 sectors combined.2
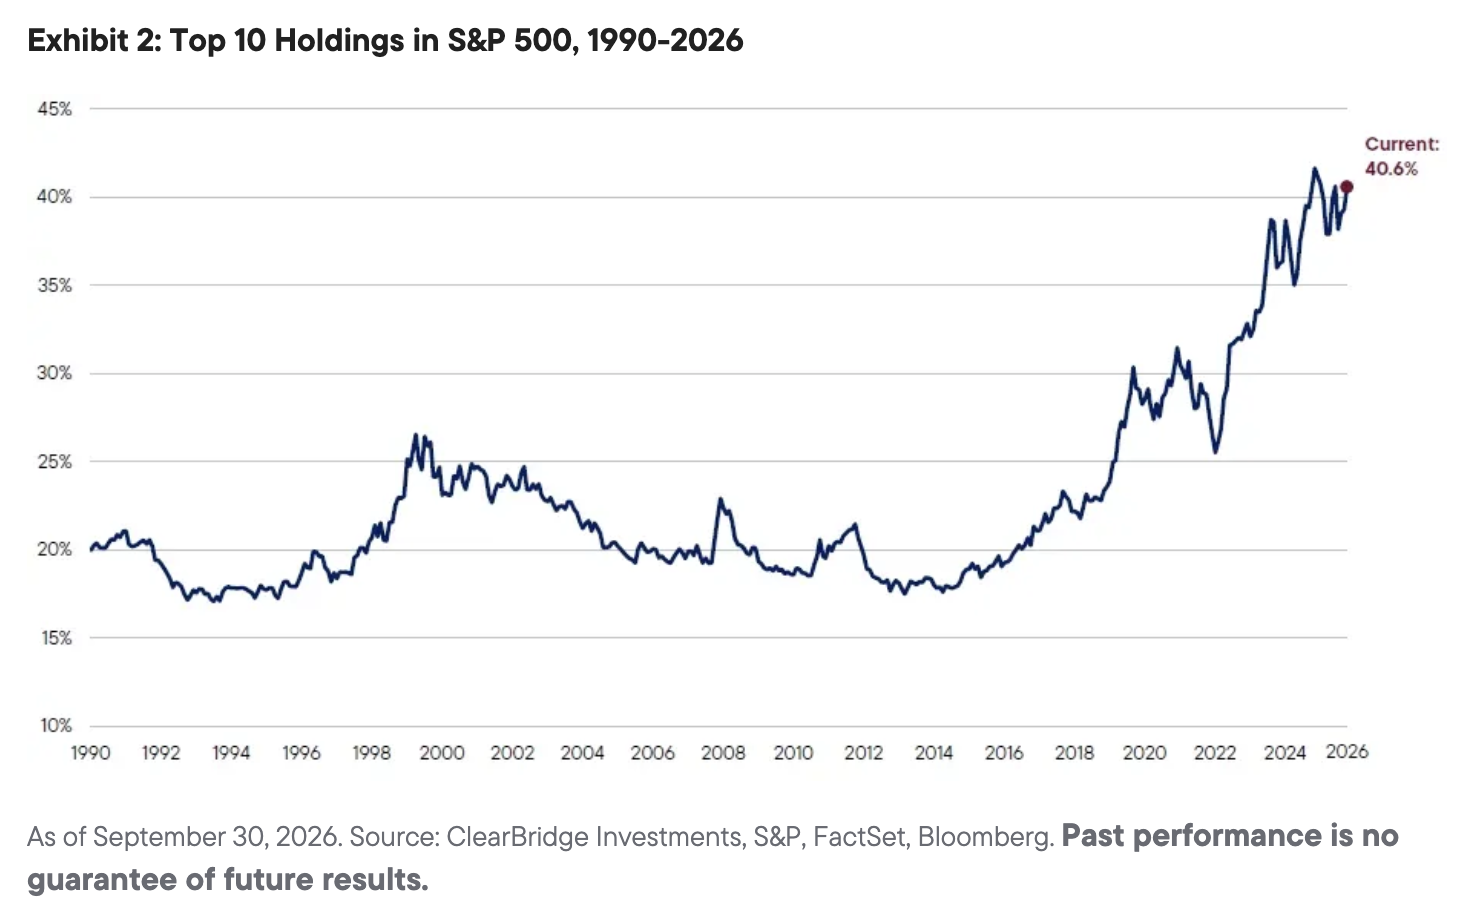
Today, the 10 largest holdings represent 40.6% of the S&P 500 (Exhibit 2). For context, that figure hovered around 20% for most of the last 35 years, breaching 25% only at the height of the dot-com bubble before rising sharply beginning in 2020.
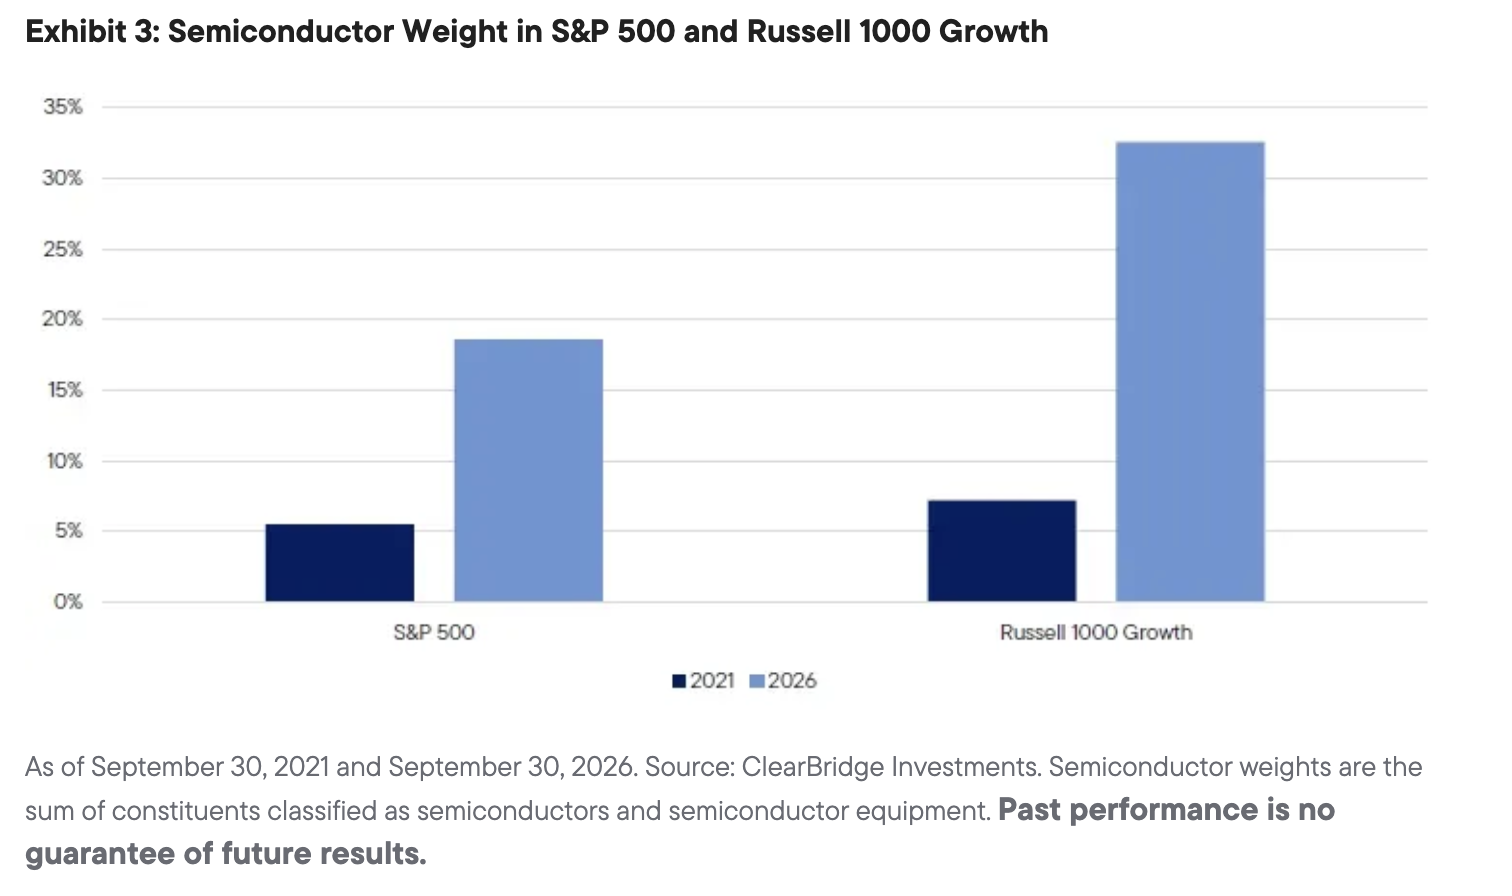
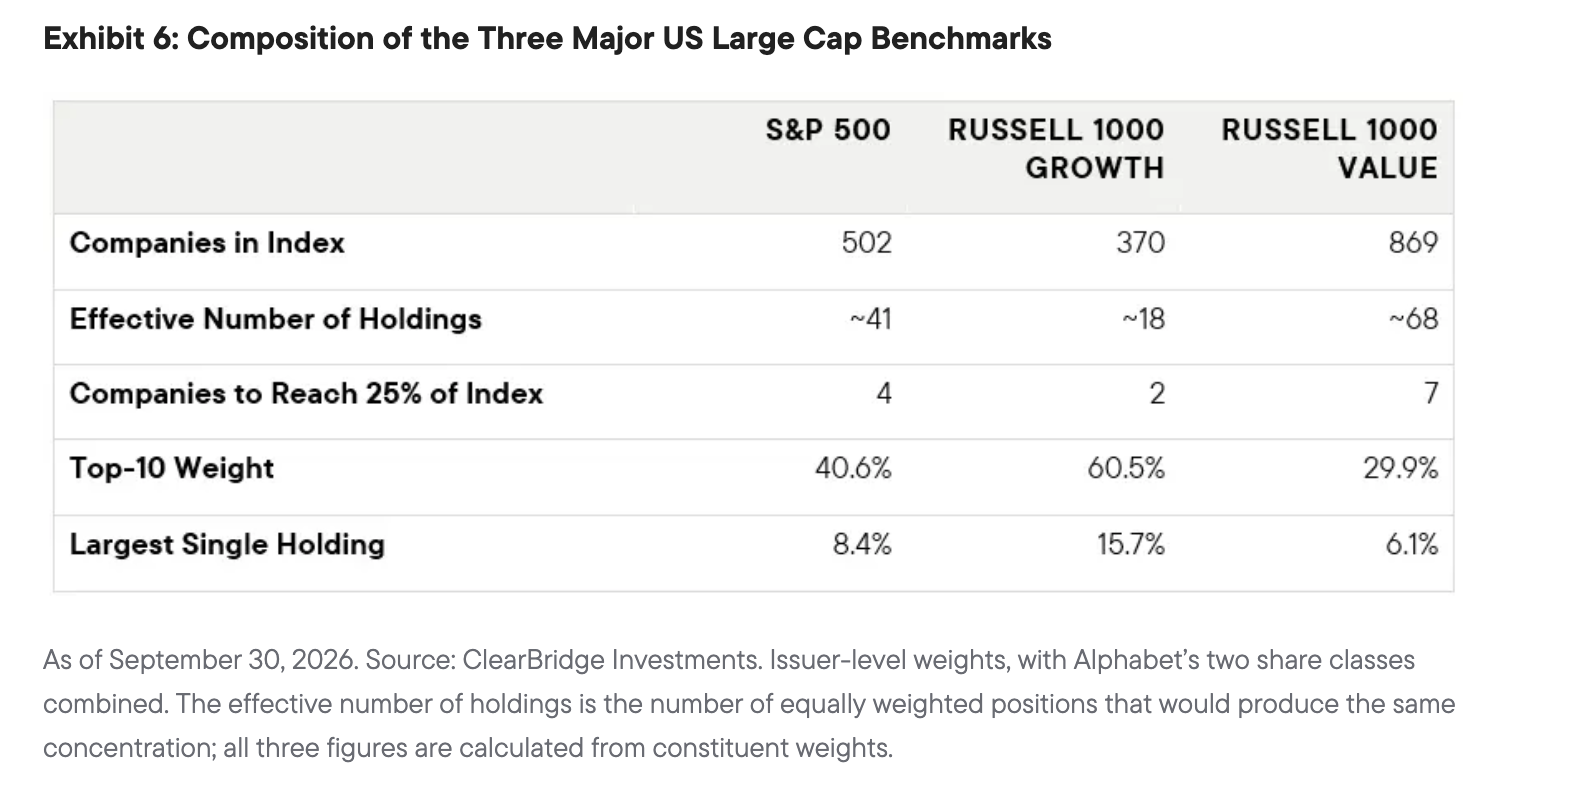
Growth stocks are even less diversified. In the Russell 1000 Growth, two companies—Nvidia and Alphabet—make up a quarter of the index and seven make up half.3 The top 10 make up 60.5%. Nvidia alone is 15.7%—roughly one dollar in six. Approximately a third of the index is semiconductors, which have grown in weight dramatically here as they have in the S&P 500 (Exhibit 3).
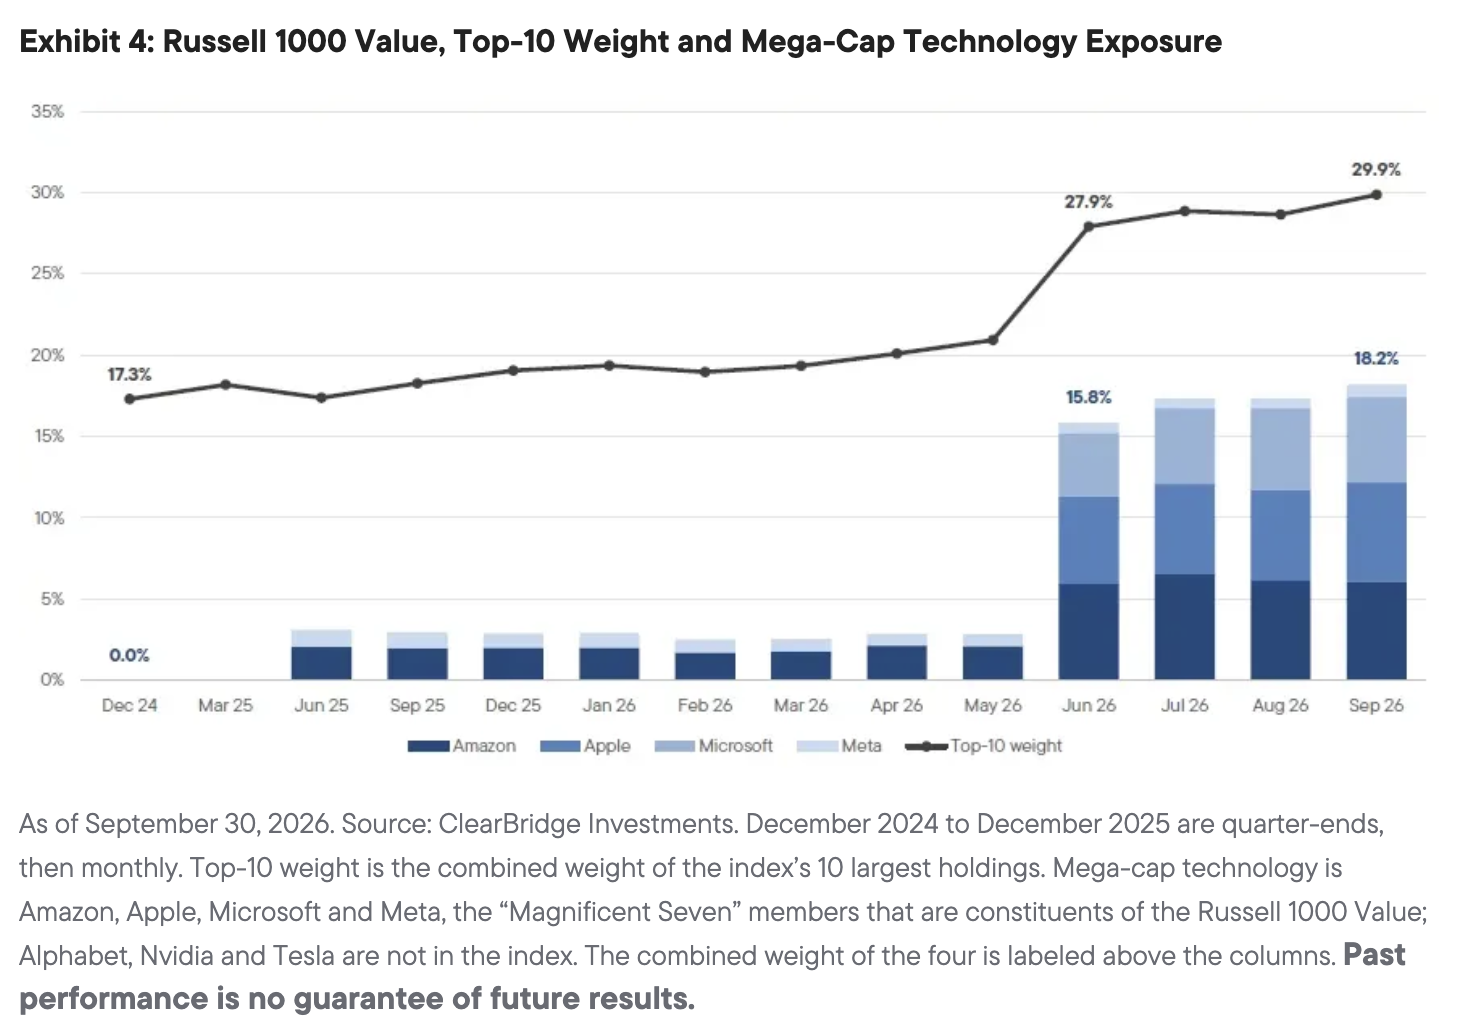
The Russell 1000 Value has been less concentrated than the other two benchmarks since 2018, and remains the least concentrated of the three, but it has changed the fastest since the end of 2024. The weight of its top 10 stocks went from 17% at the end of 2024 to 30% today. Its exposure to mega-cap technology and internet companies (Amazon, Apple, Microsoft and Meta) went from zero at the end of 2024 to about 18% today, most of it added in June 2026 (Exhibit 4).4
With Amazon, Apple and Microsoft its three largest holdings, the value benchmark is no longer a reliable way to step away from the companies that dominate the core and growth benchmarks.
Core, Growth and Value–Are Investors Unknowingly Putting All Their Eggs in One Basket?
Set the three indexes side-by-side and the comparison is shocking: Apple and Microsoft each exceed 5% of all three benchmarks simultaneously (Exhibit 5). Nvidia and Alphabet each exceed 5% of two.
The S&P 500 is Effectively an S&P 41
While there are roughly 500 stocks in the S&P 500, it does not diversify like an equal-weighted portfolio of 500 stocks. As a capitalization-weighted index, a 10% position exerts as much force in the index as 50 names that are 20 basis points each. For the roughly 500 constituents in the S&P 500 today, the effective number of holdings is 41 (Exhibit 6). In other words, the S&P 500 diversifies like a portfolio of 41. In 2016 it diversified like a portfolio of 138. The growth and value benchmarks also diversify much less than their names would suggest.
Concentration Amplifies Volatility
As indexes become more concentrated, they become more volatile, as we saw in the selloff following the 2026 US midterm elections. As of the end of the third quarter, a 10% move up or down in Nvidia—which it has matched or exceeded in about a third of the months since March 2025—moves the S&P 500 by 0.84 points and the Russell 1000 Growth by 1.57 points. A 25% decline across the 10 largest S&P 500 holdings would cost the index 10.1%. At 2010 weights, the same decline would have cost about 4.7%.5 Traditional risk statistics obscure this dynamic because the beta of the benchmark is always 1.0, no matter how volatile it is.
Increasing Active Allocations Will Reduce Risk
Traditional asset allocation has become inverted. Passive was supposed to be the diversified, broad, risk-spread component—the beta. Active was the concentrated version, bought for alpha. Today the index is the concentrated position and most investors are unaware of the risks embedded in their “diversified” portfolios. Thoughtful investors must move beyond style boxes and away from concentrated benchmarks and increase their active exposure.
Endnotes
- Companies are ranked by index weight of September 30, 2026, with Alphabet’s two share classes combined. The four largest (Nvidia, Apple, Microsoft and Alphabet) total 27.0% and the 20 largest total 50.6%. Source: ClearBridge Investments.
- Sector weights of September 30, 2026. Nvidia is 8.4% of the S&P 500, versus 3.4% for energy, 1.9% for utilities and 1.7% for real estate (7.0% combined). Nvidia, Apple and Microsoft together are 21.5%, versus 21.1% for the six smallest sectors combined (industrials, consumer staples, energy, utilities, materials and real estate). Source: ClearBridge Investments.
- Russell 1000 Growth of September 30, 2026, with Alphabet’s two share classes combined: the two largest holdings (Nvidia and Alphabet) total 26.3%, the seven largest total 51.8% and the 10 largest total 60.5%. Source: ClearBridge Investments.
- Mega cap technology here means the members of the “Magnificent Seven” (Alphabet, Amazon, Apple, Meta, Microsoft, Nvidia and Tesla) that are constituents of the Russell 1000 Value: Amazon, Apple, Microsoft and Meta. Alphabet, Nvidia and Tesla are not in the index.
- Each figure holds all else equal. A 10% move in Nvidia is 10% of its weight at September 30, 2026 (8.4% in the S&P 500 and 15.7% in the Russell 1000 Growth). A 25% decline in the 10 largest S&P 500 holdings is 25% of their combined weight (40.6% today, and 19% in 2010 per Exhibit 1). Nvidia moved 10% or more in six of the 19 months from March 2025 through September 2026. Source: ClearBridge Investments.
DEFINITIONS
Indexes are unmanaged and one cannot directly invest in them. They do not include fees, expenses or sales charges. Past performance is not an indicator of future results.
Alpha: a measure of portfolio performance vs. a benchmark, relative to the volatility of that benchmark. An alpha greater than zero suggests that the portfolio has outperformed during the period by means other than adding volatility.
Beta: measures the sensitivity of an investment to the movement of its benchmark. A beta higher than 1.0 indicates the investment has been more volatile than the benchmark and a beta of less than 1.0 indicates that the investment has been less volatile than the benchmark.
The S&P 500® Index is an unmanaged index of 500 stocks that is generally representative of the performance of larger companies in the United States.
The Russell 1000 Value and Growth indexes consist of the respective value and growth stocks within the Russell 1000 as determined by Russell Investments.
WHAT ARE THE RISKS?
All investments involve risks, including possible loss of principal.
Equity securities are subject to price fluctuation and possible loss of principal.
Small- and mid-cap stocks involve greater risks and volatility than large-cap stocks.
Any companies and/or case studies referenced herein are used solely for illustrative purposes; any investment may or may not be currently held by any portfolio advised by Franklin Templeton. The information provided is not a recommendation or individual investment advice for any particular security, strategy, or investment product and is not an indication of the trading intent of any Franklin Templeton managed portfolio.
Diversification does not guarantee a profit or protect against a loss.
Active management does not ensure gains or protect against market declines.
Important Information
This material is intended to be of general interest only and should not be construed as individual investment advice or a recommendation or solicitation to buy, sell or hold any security or to adopt any investment strategy. It does not constitute legal or tax advice. This material may not be reproduced, distributed or published without prior written permission from Franklin Templeton.
The views expressed are those of the investment manager and the comments, opinions and analyses are rendered as at publication date and may change without notice. The underlying assumptions and these views are subject to change based on market and other conditions and may differ from other portfolio managers or of the firm as a whole. The information provided in this material is not intended as a complete analysis of every material fact regarding any country, region or market. There is no assurance that any prediction, projection or forecast on the economy, stock market, bond market or the economic trends of the markets will be realized. The value of investments and the income from them can go down as well as up and you may not get back the full amount that you invested. Past performance is not necessarily indicative nor a guarantee of future performance. All investments involve risks, including possible loss of principal.
Any research and analysis contained in this material has been procured by Franklin Templeton for its own purposes and may be acted upon in that connection and, as such, is provided to you incidentally. Data from third party sources may have been used in the preparation of this material and Franklin Templeton ("FT") has not independently verified, validated or audited such data. Although information has been obtained from sources that Franklin Templeton believes to be reliable, no guarantee can be given as to its accuracy and such information may be incomplete or condensed and may be subject to change at any time without notice. The mention of any individual securities should neither constitute nor be construed as a recommendation to purchase, hold or sell any securities, and the information provided regarding such individual securities (if any) is not a sufficient basis upon which to make an investment decision. FT accepts no liability whatsoever for any loss arising from use of this information and reliance upon the comments, opinions and analyses in the material is at the sole discretion of the user.
Franklin Templeton has environmental, social and governance (ESG) capabilities; however, not all strategies or products for a strategy consider “ESG” as part of their investment process.
Products, services and information may not be available in all jurisdictions and are offered outside the U.S. by other FT affiliates and/or their distributors as local laws and regulation permits. Please consult your own financial professional or Franklin Templeton institutional contact for further information on availability of products and services in your jurisdiction.
Issued in the U.S. by Franklin Templeton, One Franklin Parkway, San Mateo, California 94403-1906, (800) DIAL BEN/342-5236, franklintempleton.com. Investments are not FDIC insured; may lose value; and are not bank guaranteed.
You need Adobe Acrobat Reader to view and print PDF documents. Download a free version from Adobe's website.
CFA® and Chartered Financial Analyst® are trademarks owned by CFA Institute.
A message from Advisor Perspectives and VettaFi: Discover something new! Click here to register for our upcoming webcasts.
© ClearBridge Investments
More Innovative ETFs Topics >