Bull Market vs. Bear Market
A bull market occurs when stocks are rising, the economy is expanding, and there is overall optimism towards market conditions. On the contrary, a bear market occurs when stock prices are falling, the economy is contracting, and there is overall pessimism towards market conditions. There are a handful of theories as to where the "bear" and "bull" names originated from for describing the stock market but the one that I find the most helpful is that they are derived from the way the animals attack their opponents. A bull thrusts its horns up in the air; a bear swipes its paws down.
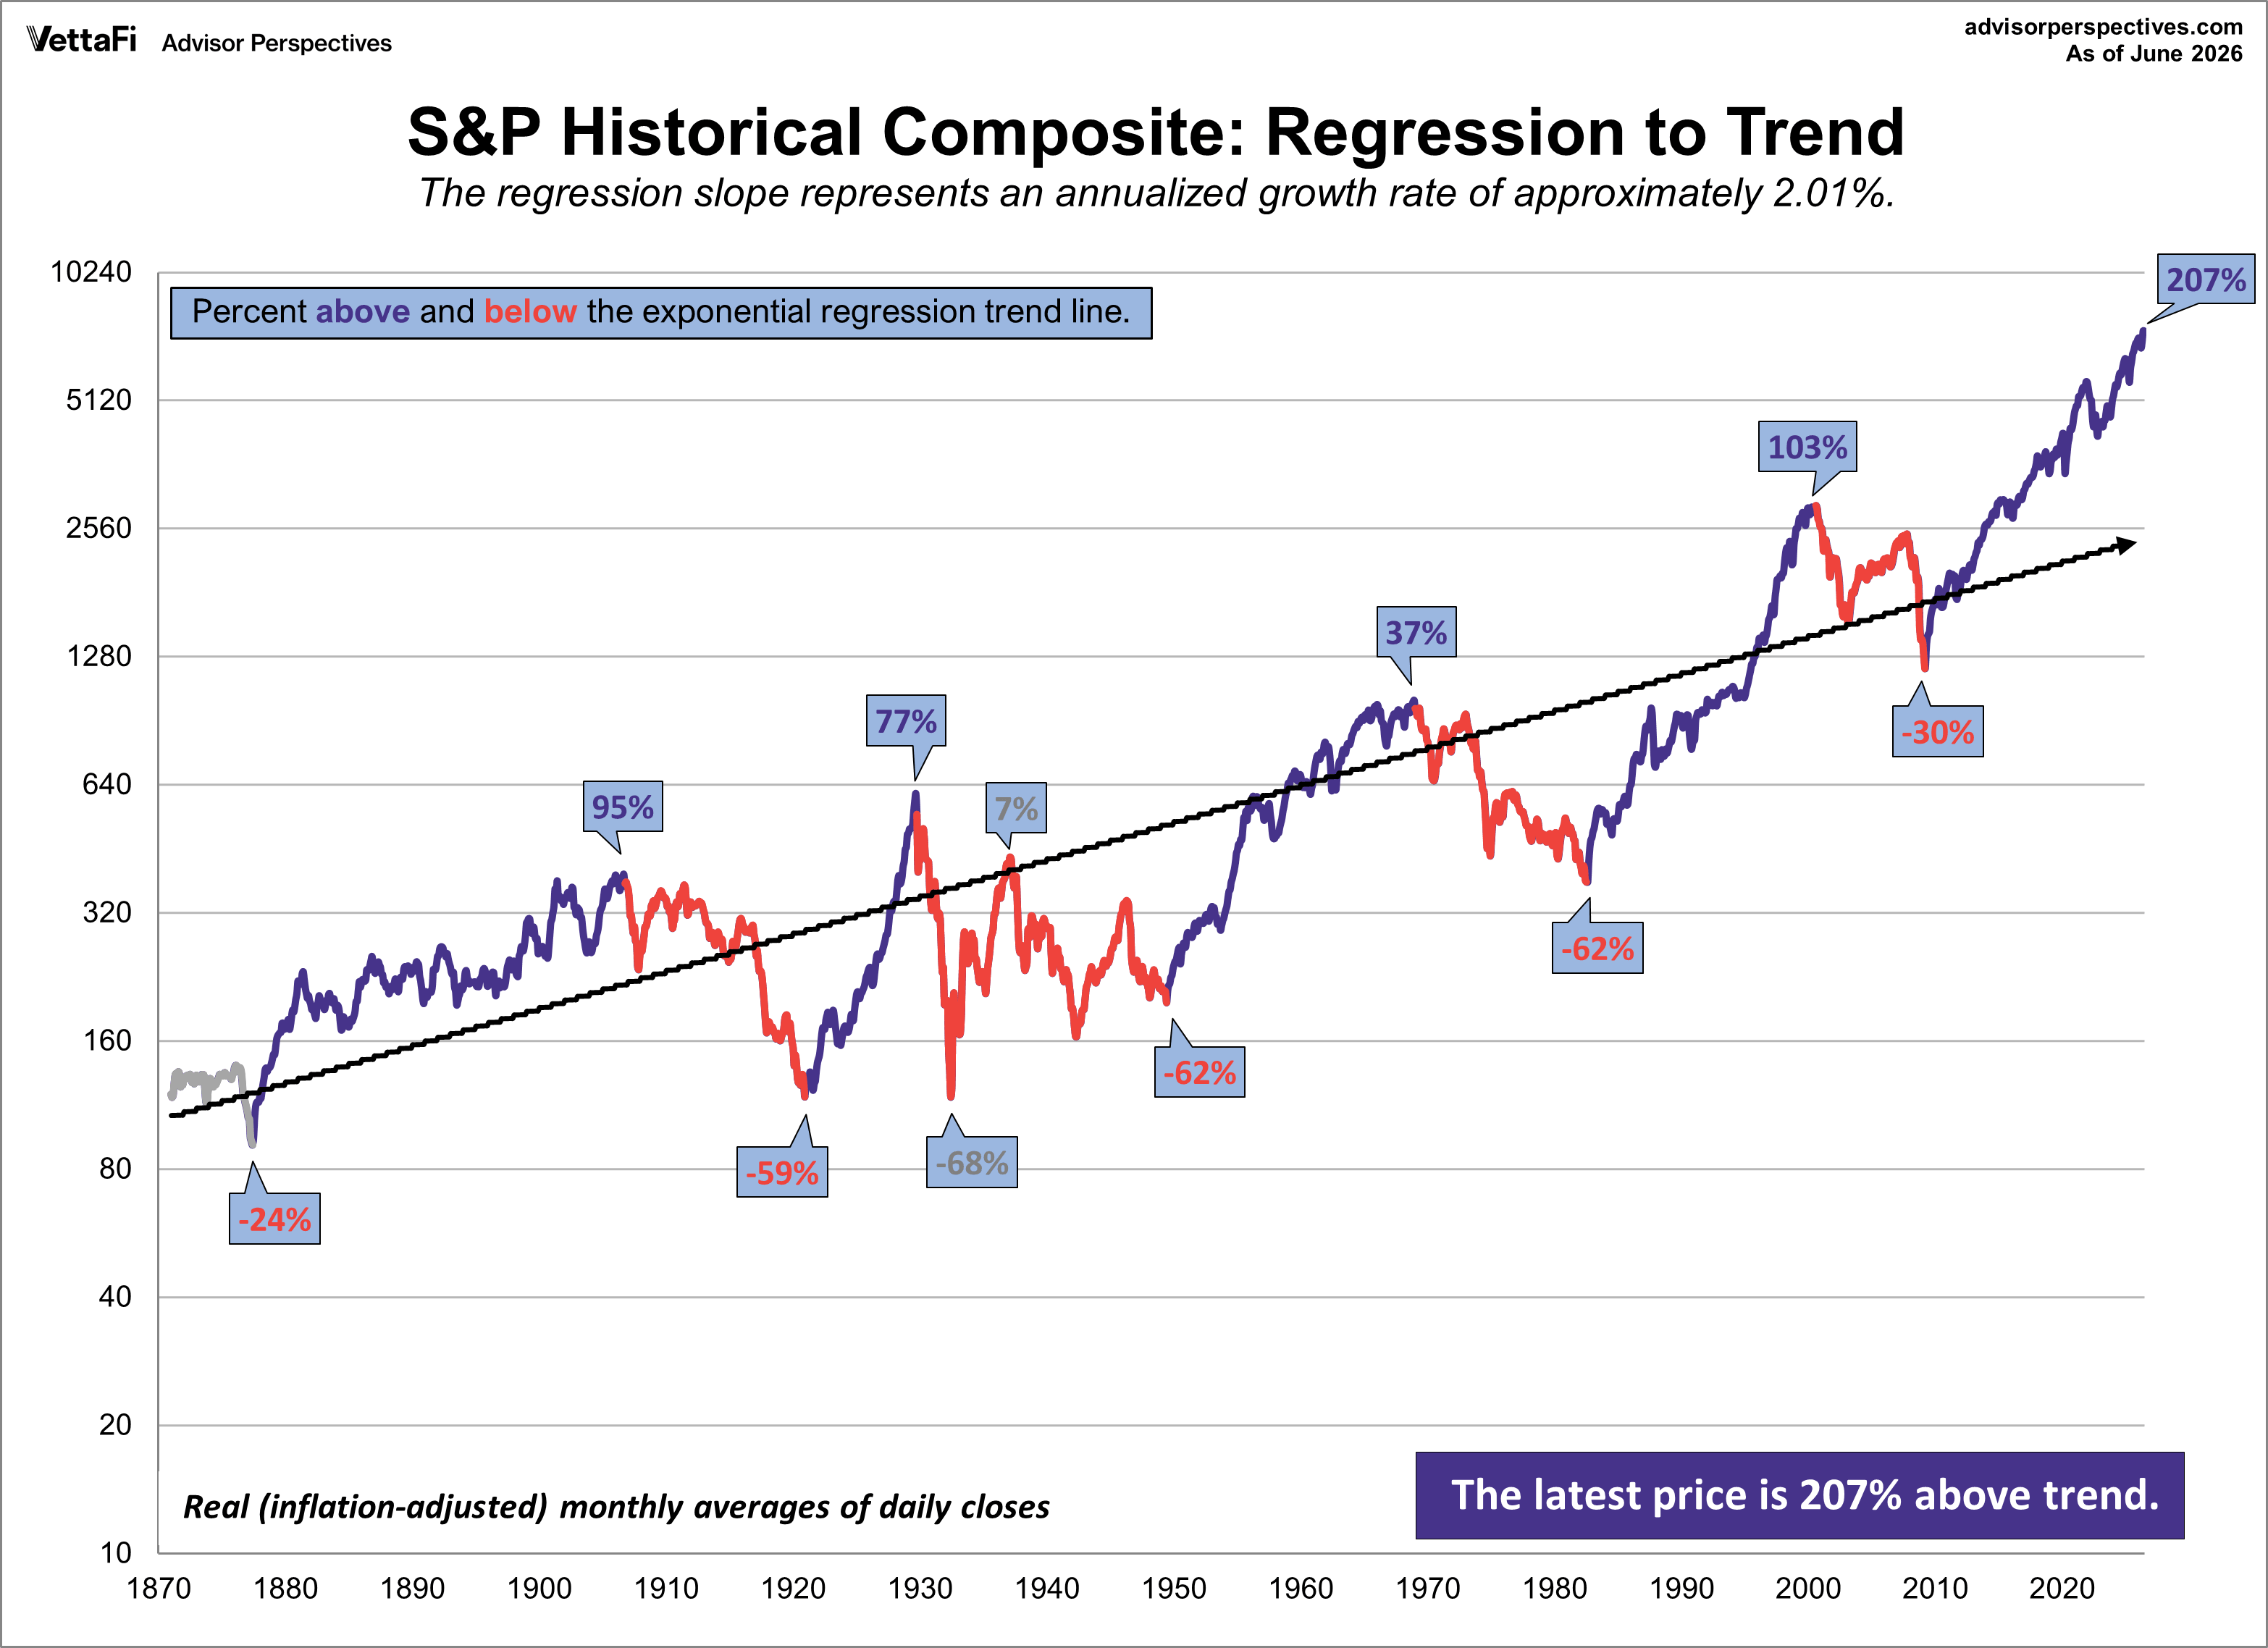
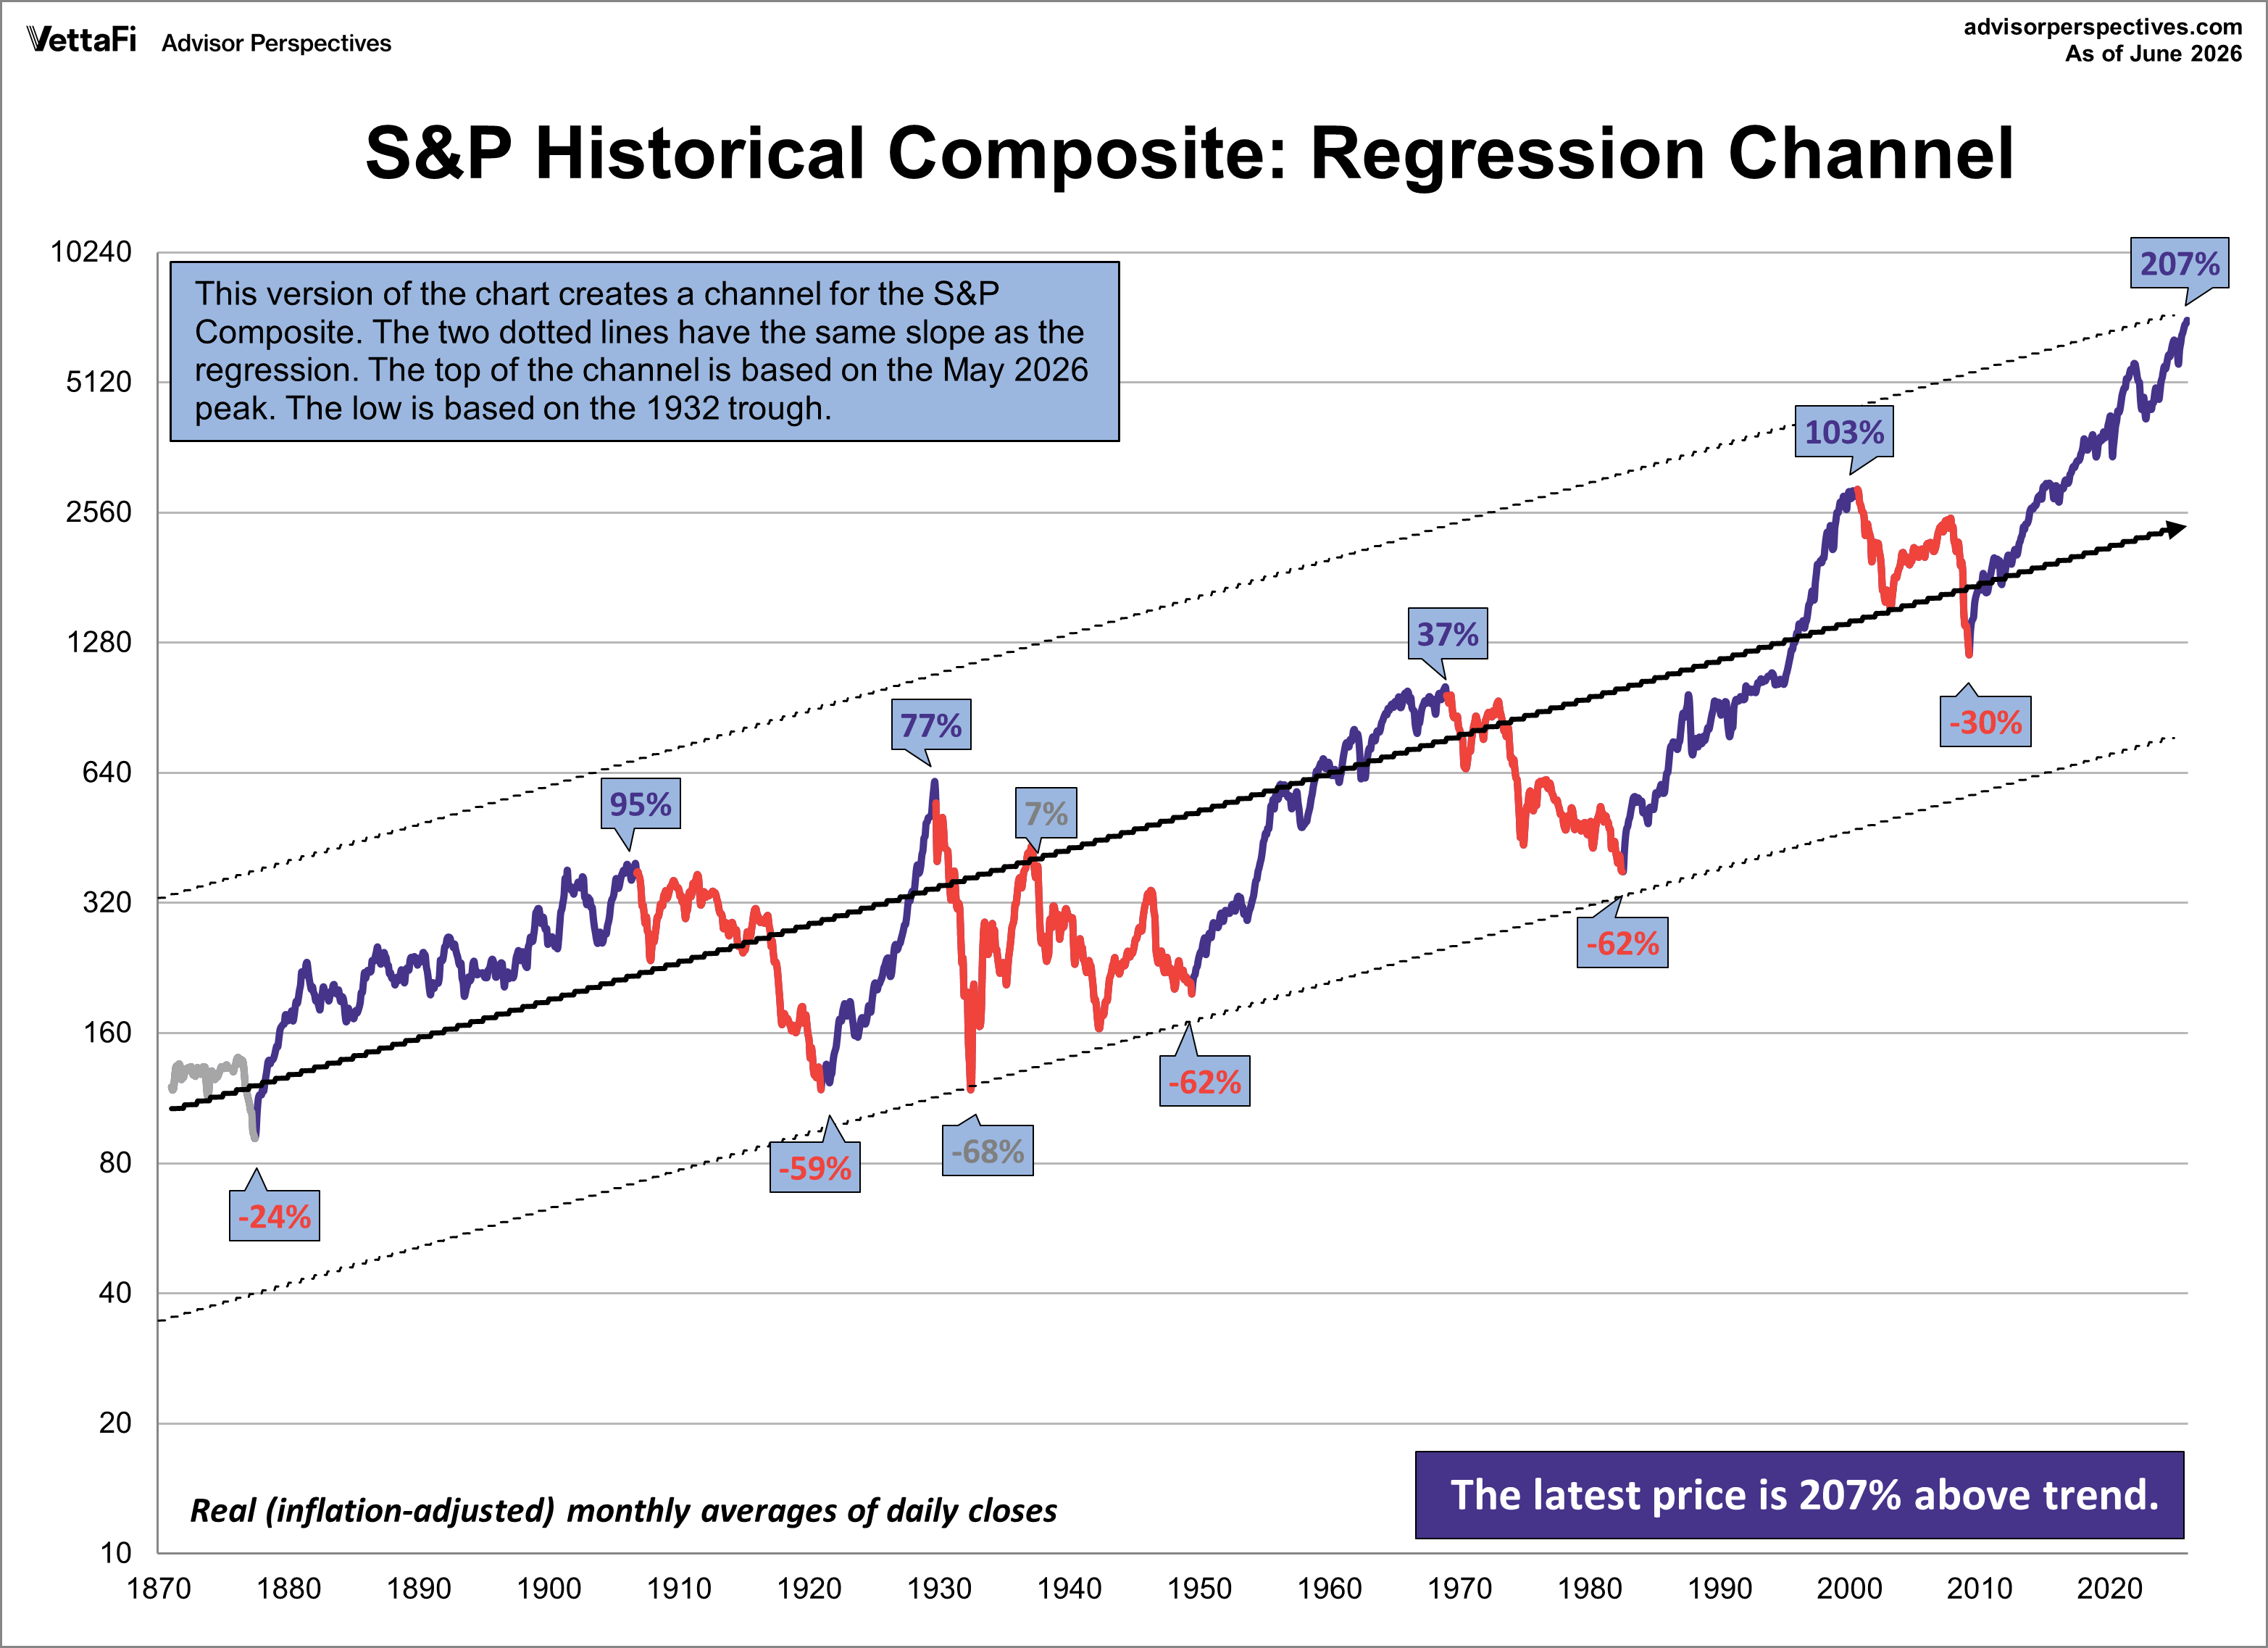
Let's examine the past to broaden our understanding of the range of historical bull and bear market trends in market performance. An obvious feature of this inflation-adjusted series is the pattern of long-term alternations between uptrends and downtrends. Market historians call these "secular" bull and bear markets from the Latin word saeculum "long period of time" (in contrast to aeternus "eternal" — the type of bull market we fantasize about).
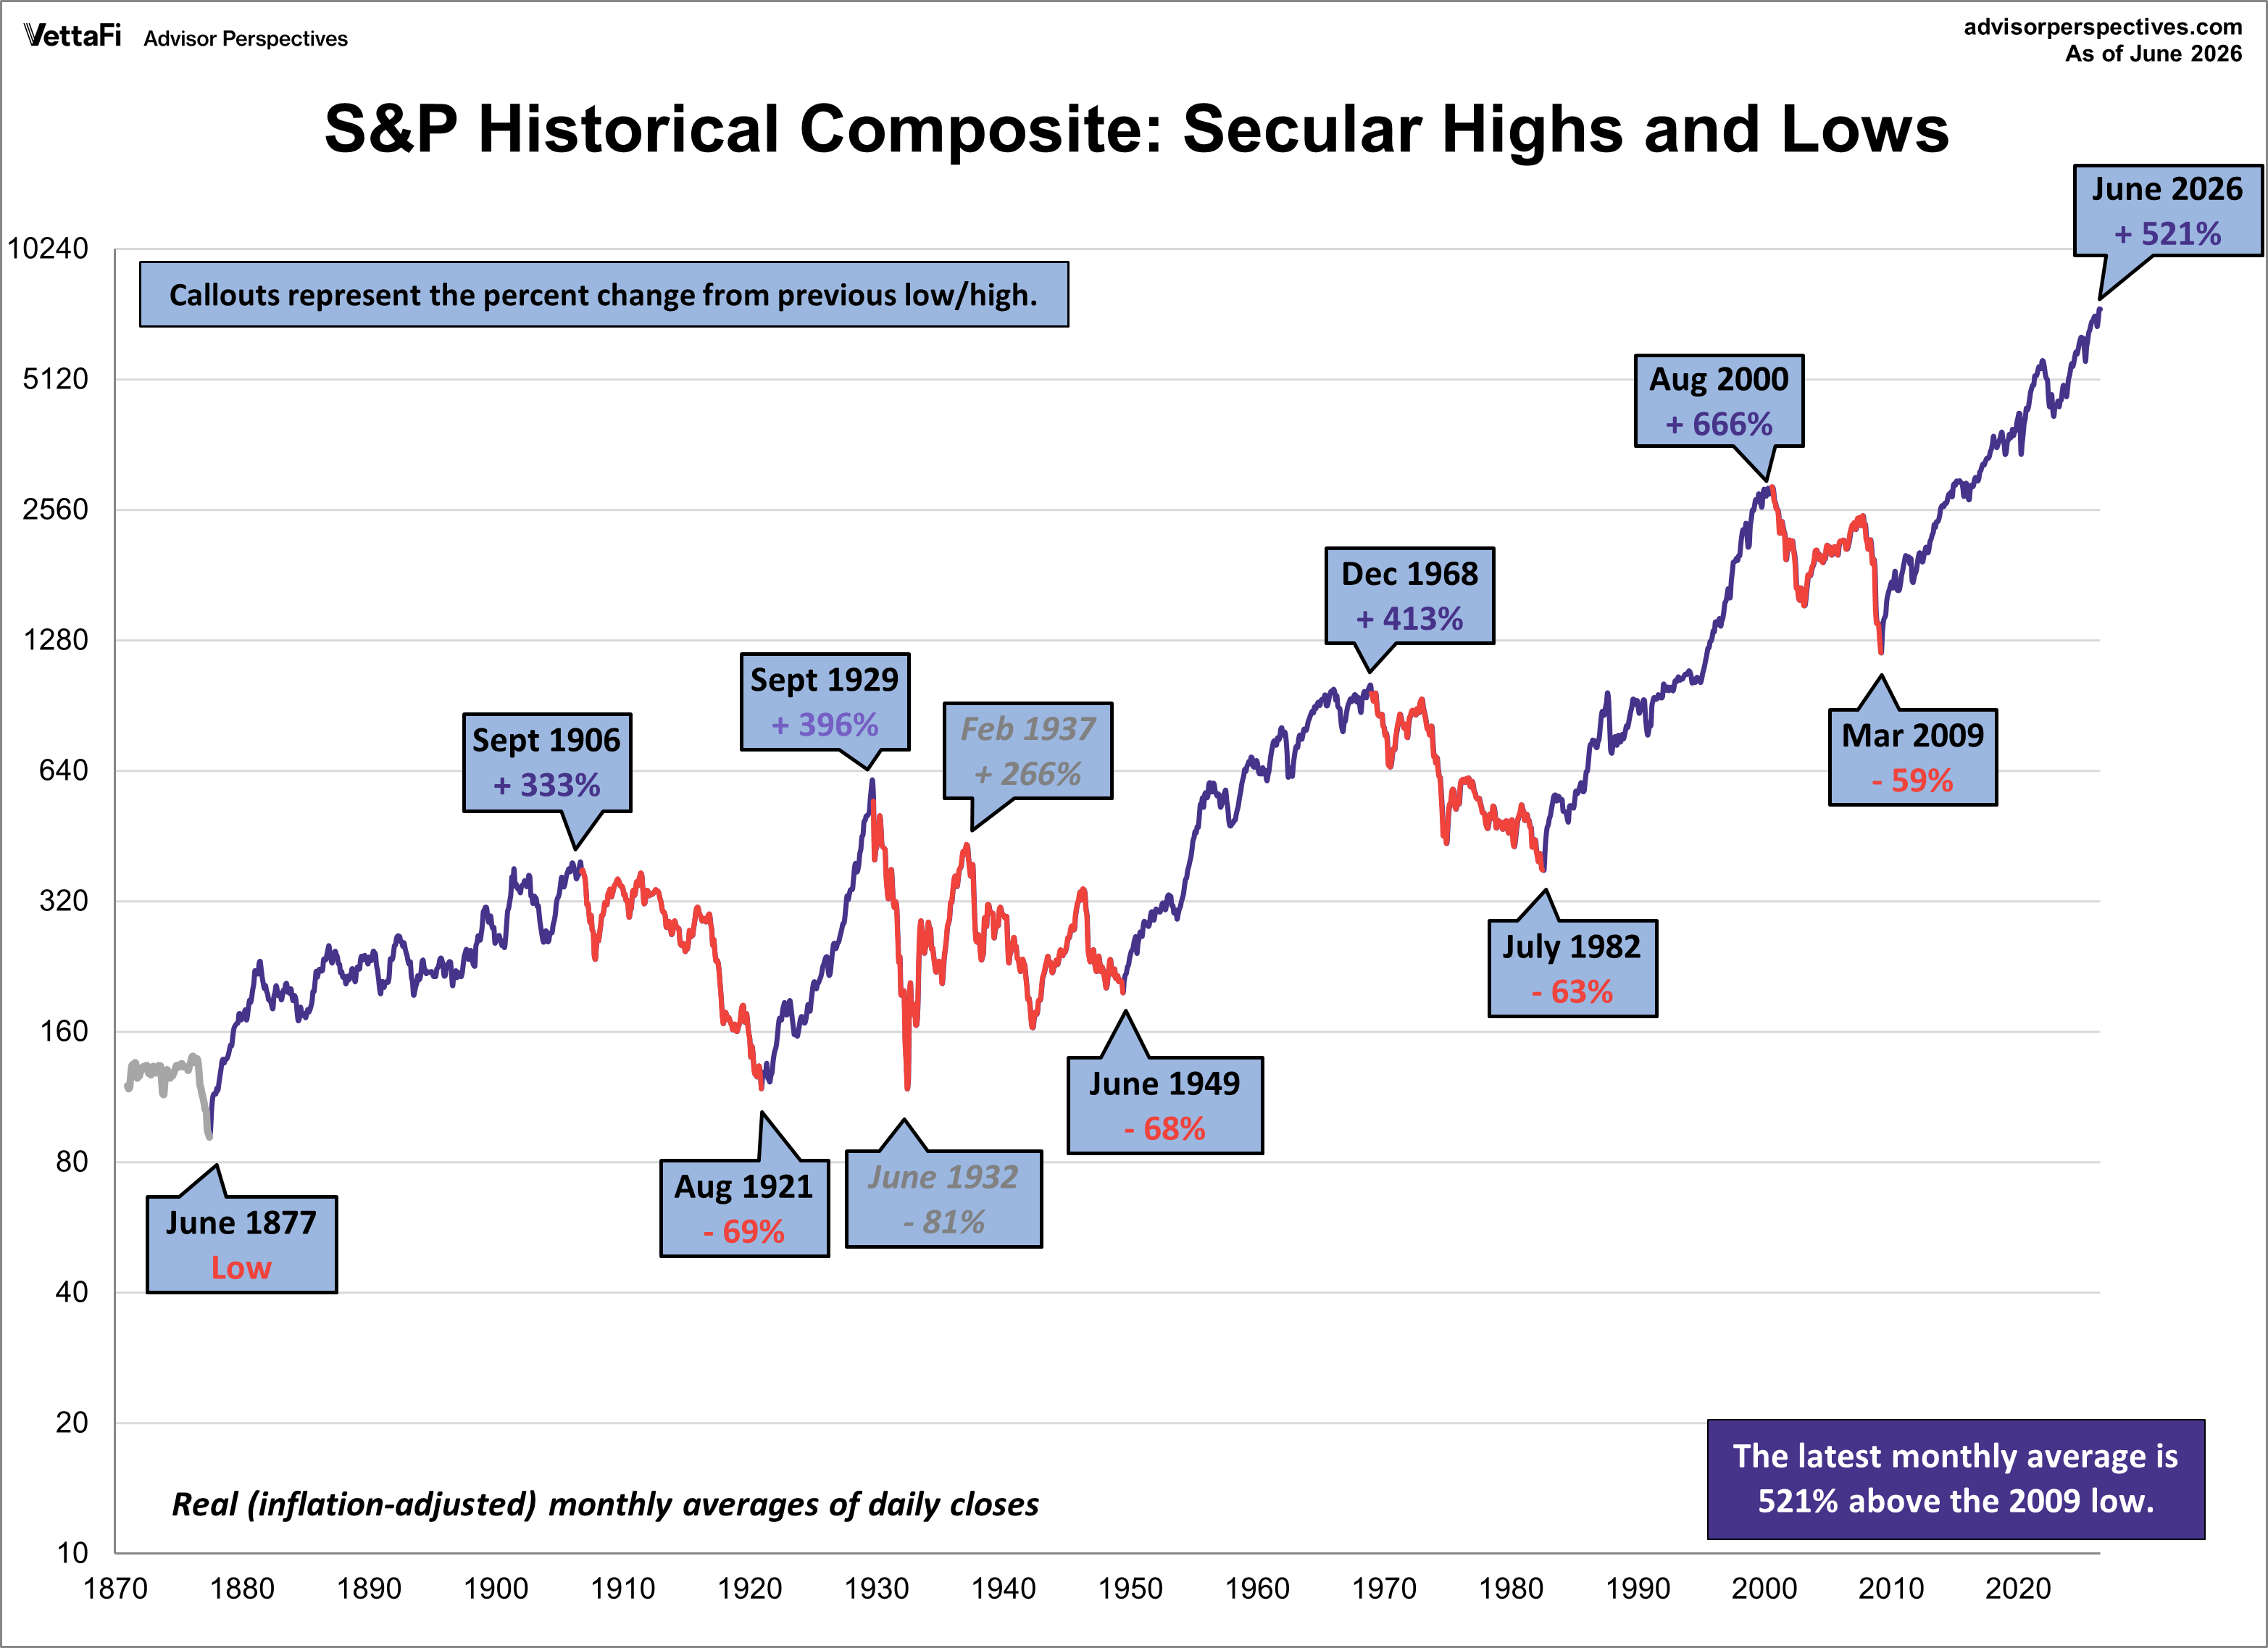
The key word on the chart above is secular. The implicit rule we're following is that purple shows secular trends that lead to new all-time real highs. The red periods in between are secular bear markets, regardless of their cyclical rallies. For example, the rally from 1932 to 1937, despite its strength, remains a cycle in a secular bear market. At its peak in 1937, the index was 29% below the real all-time high of 1929. More recently, 2022 was a bear market within the cycle of the current bull market that has been going on since 2009.
At the time of writing:
- The S&P 500's highest daily close was on June 2nd, 2026 at 7,609.78.
- The S&P 500's highest monthly average of daily closes was in June 2026 at 7,450.03.
- The S&P 500's highest real (inflation-adjusted) monthly average of daily closes was in May 2026 at 7,459.07.
S&P Composite Index Secular Trends
If we study the data underlying the chart, we can extract a number of interesting facts about these secular patterns:
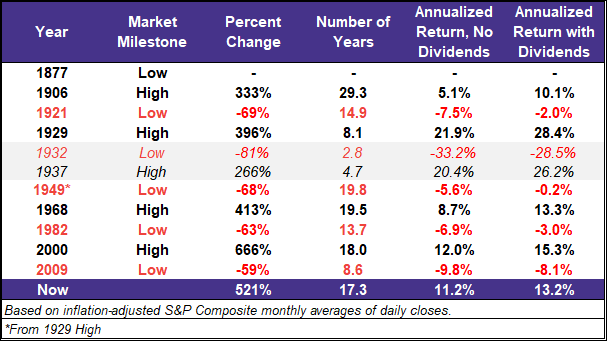
Since that first trough in 1877 to June 2026:
- Secular bull gains totaled 2,329% for an average of 466%.
- Secular bear losses totaled -258% for an average of -64%.
- Secular bull years total 92 versus 57 for the bears.
This last bullet probably comes as a surprise to many people. The finance industry and media have conditioned us to view every dip as a buying opportunity. If we realize that bear markets have accounted for 38% of the highlighted time frame, we can better understand the two massive selloffs of the 21st century.