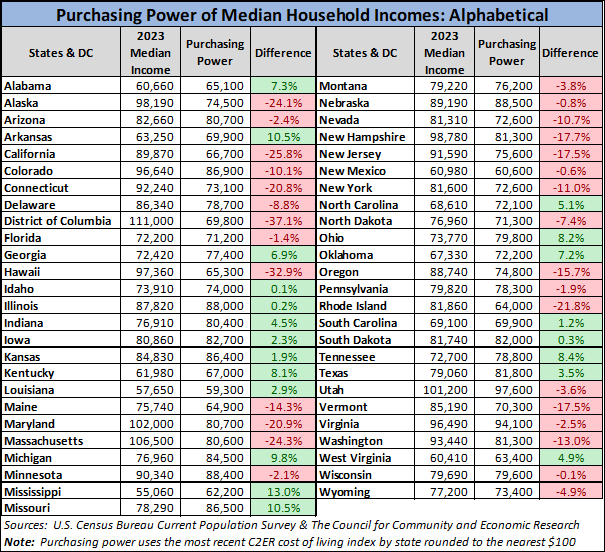
In 2023, the median US household income was $80,610. Across the states and D.C., median household incomes ranged from a high of $111,000 in Washington D.C. to a low of $55,100 in Mississippi. However, when adjusted for the 2023 Cost of Living Index, the rankings shift, with Utah leading at $97,600 and Louisiana trailing at $59,300.
Below is a table arranged alphabetically, presenting the median income for each of the 50 states and DC, along with the adjusted purchasing power based on the C2ER Cost of Living Index.
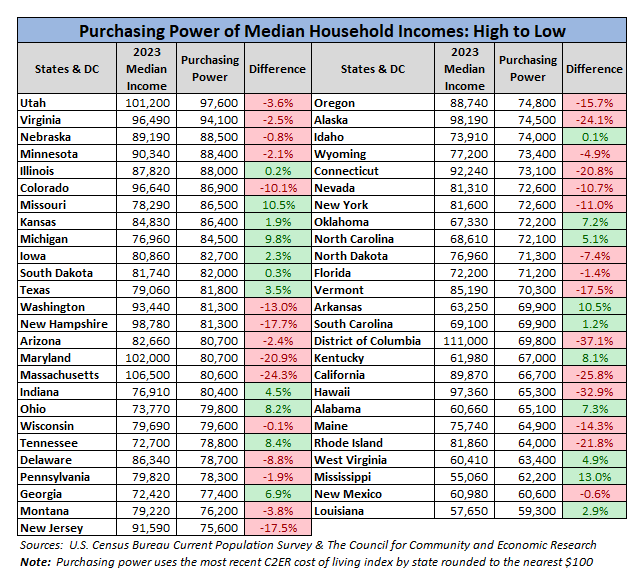
The alphabetical listing above makes it easy to find individual states, but for some additional insight, let's sort the table by the purchasing power column.
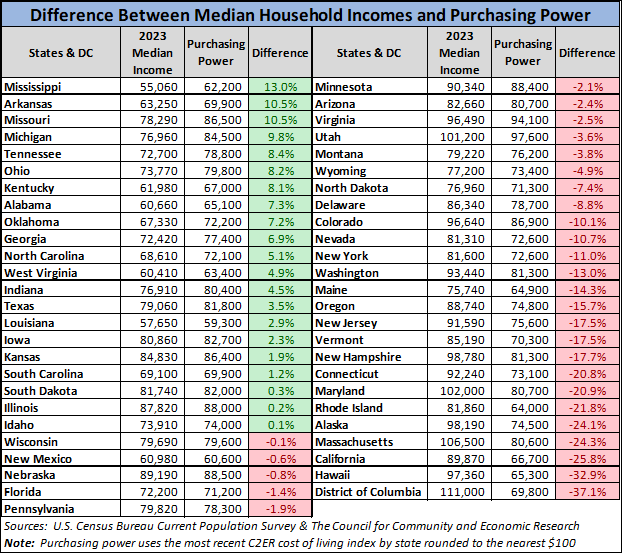
The next chart gives us a clearer sense of the relative differences between household incomes and the actual purchasing power of those incomes across the 50 states and D.C. We've calculated the differencebetween the actual median and its purchasing power in the column labeled "Difference". Twenty-one states have a median purchasing power greater than the actual dollars, with Mississippi's 13.0% benefit from a low cost of living topping the list. At the other extreme, the exorbitant cost of living in Washington D.C. cuts that state's median household income purchasing power by a sobering 37.1%, worse than New York, California, and Hawaii, which came in at -11.0%, -25.8%, and -32.9% respectively.
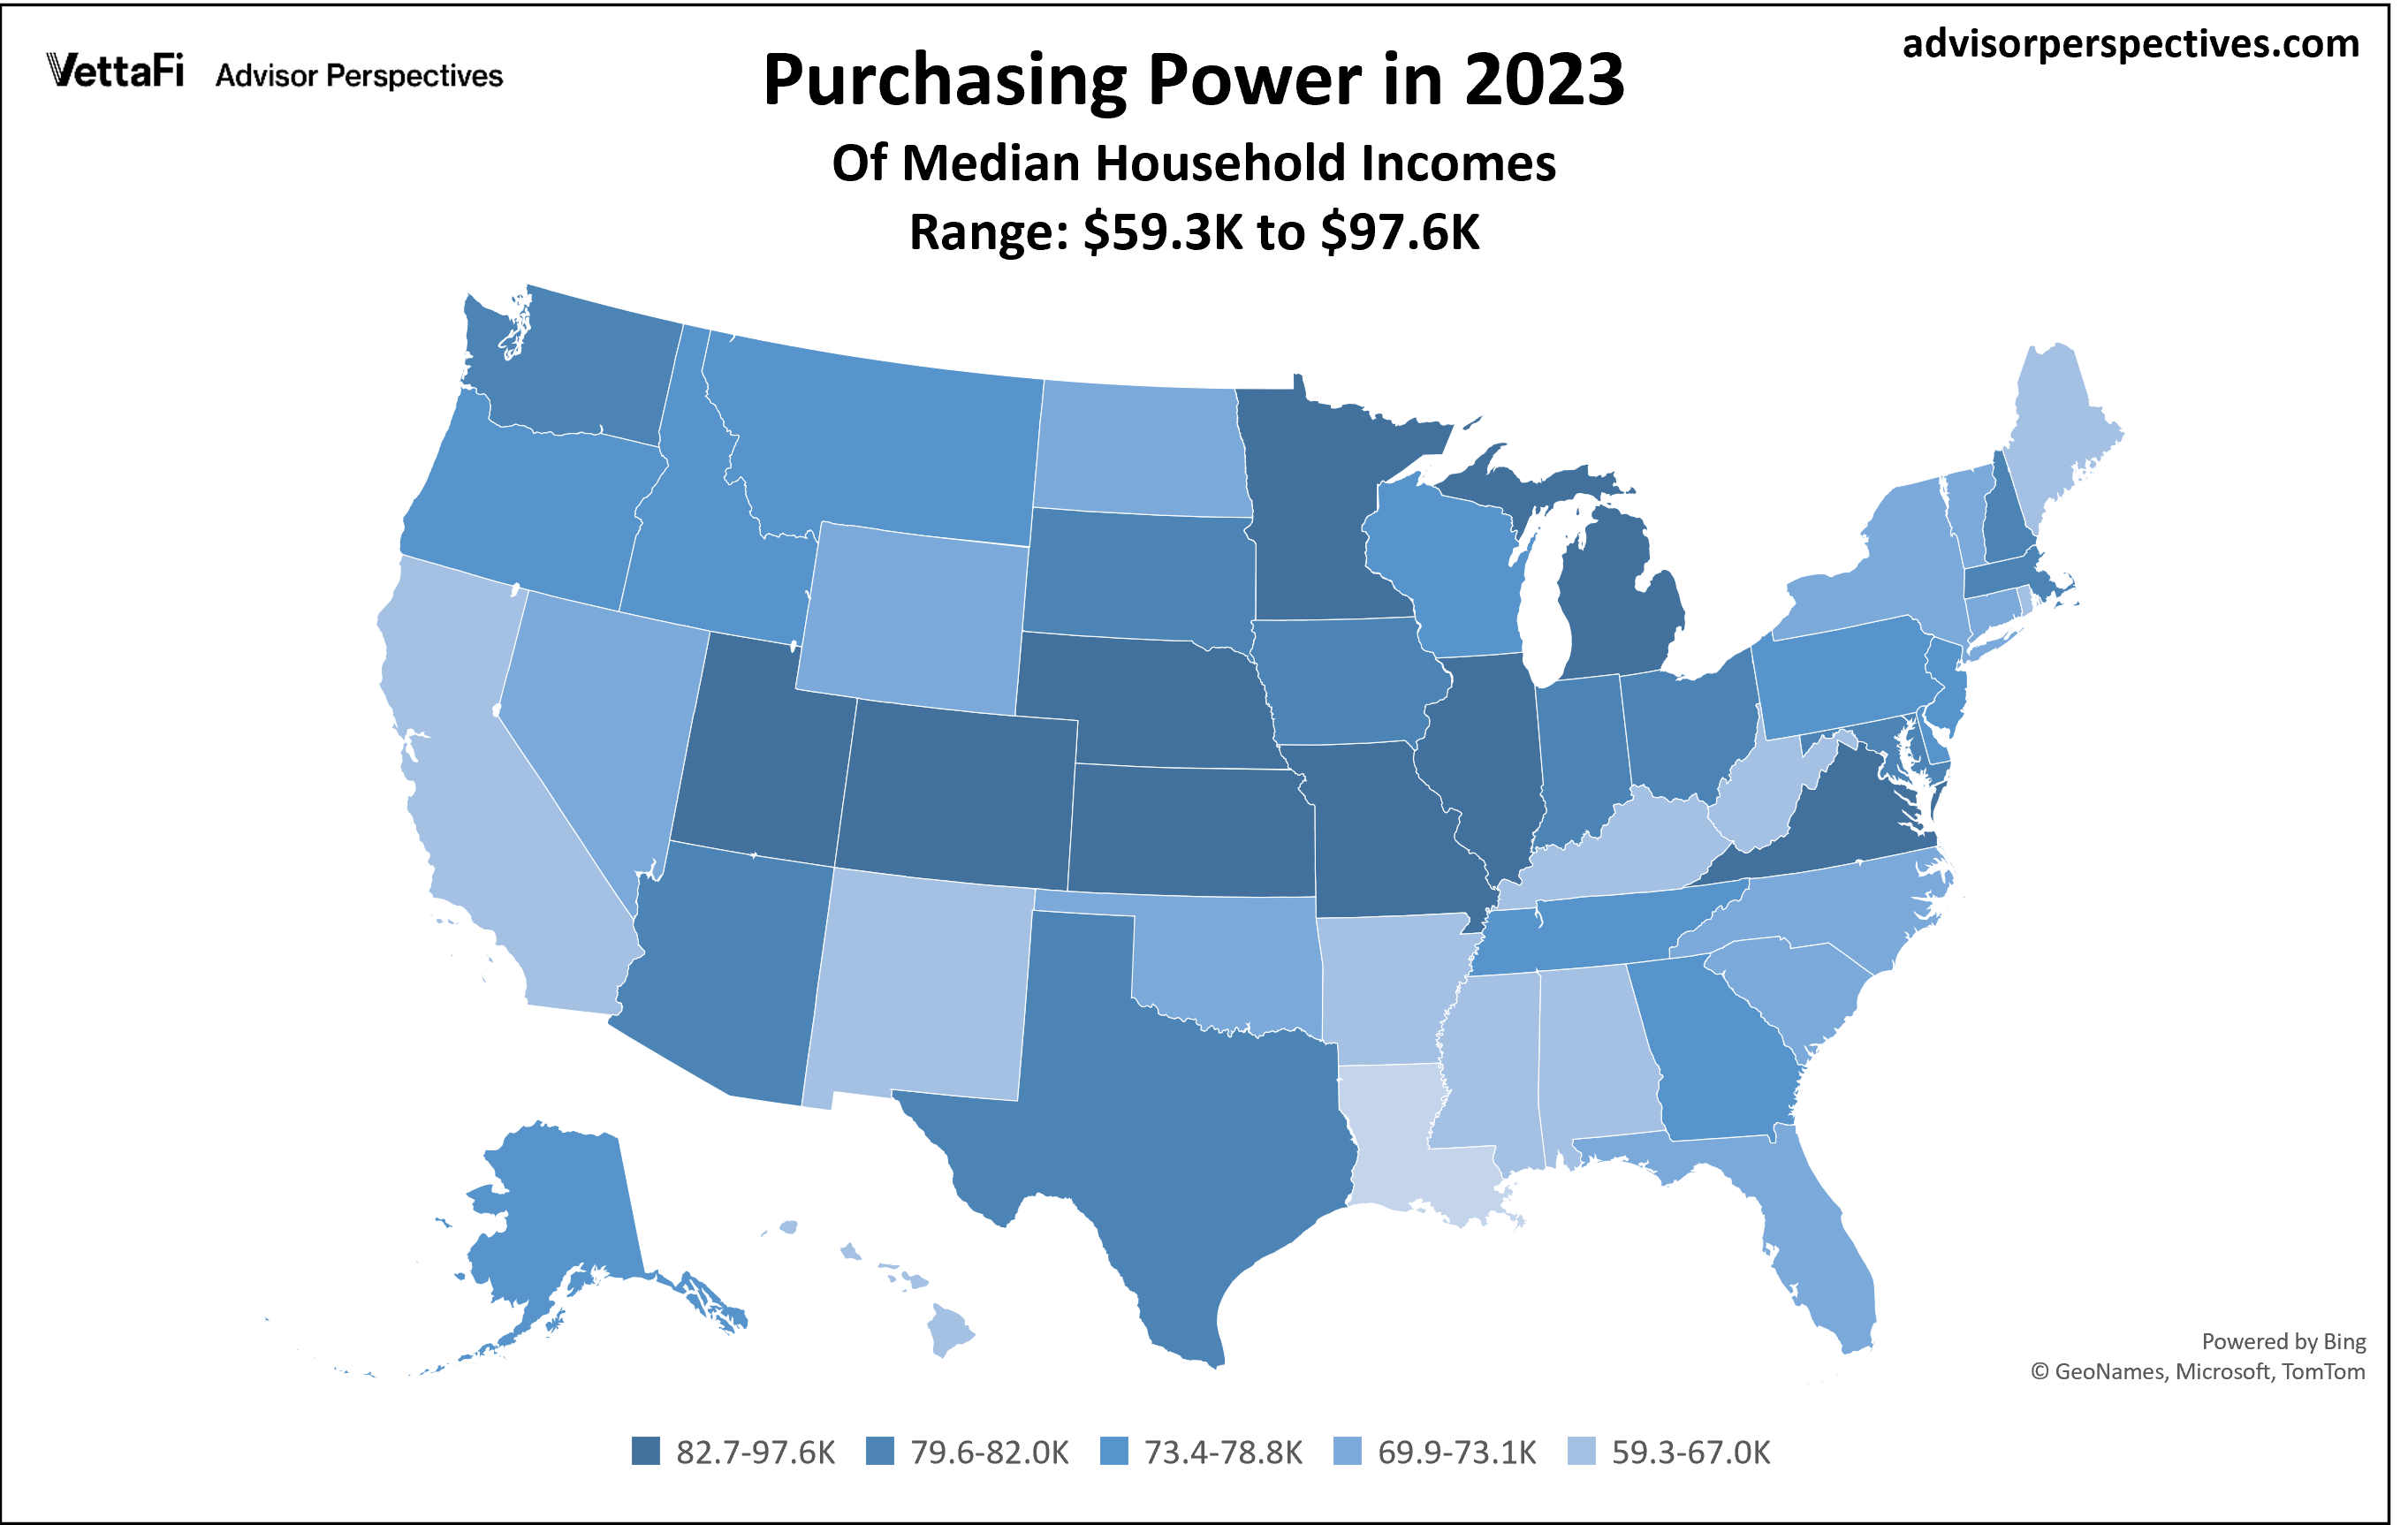
For an idea of the geographical distribution of purchasing power, here is a map that color-codes the states based on a quintile breakdown.
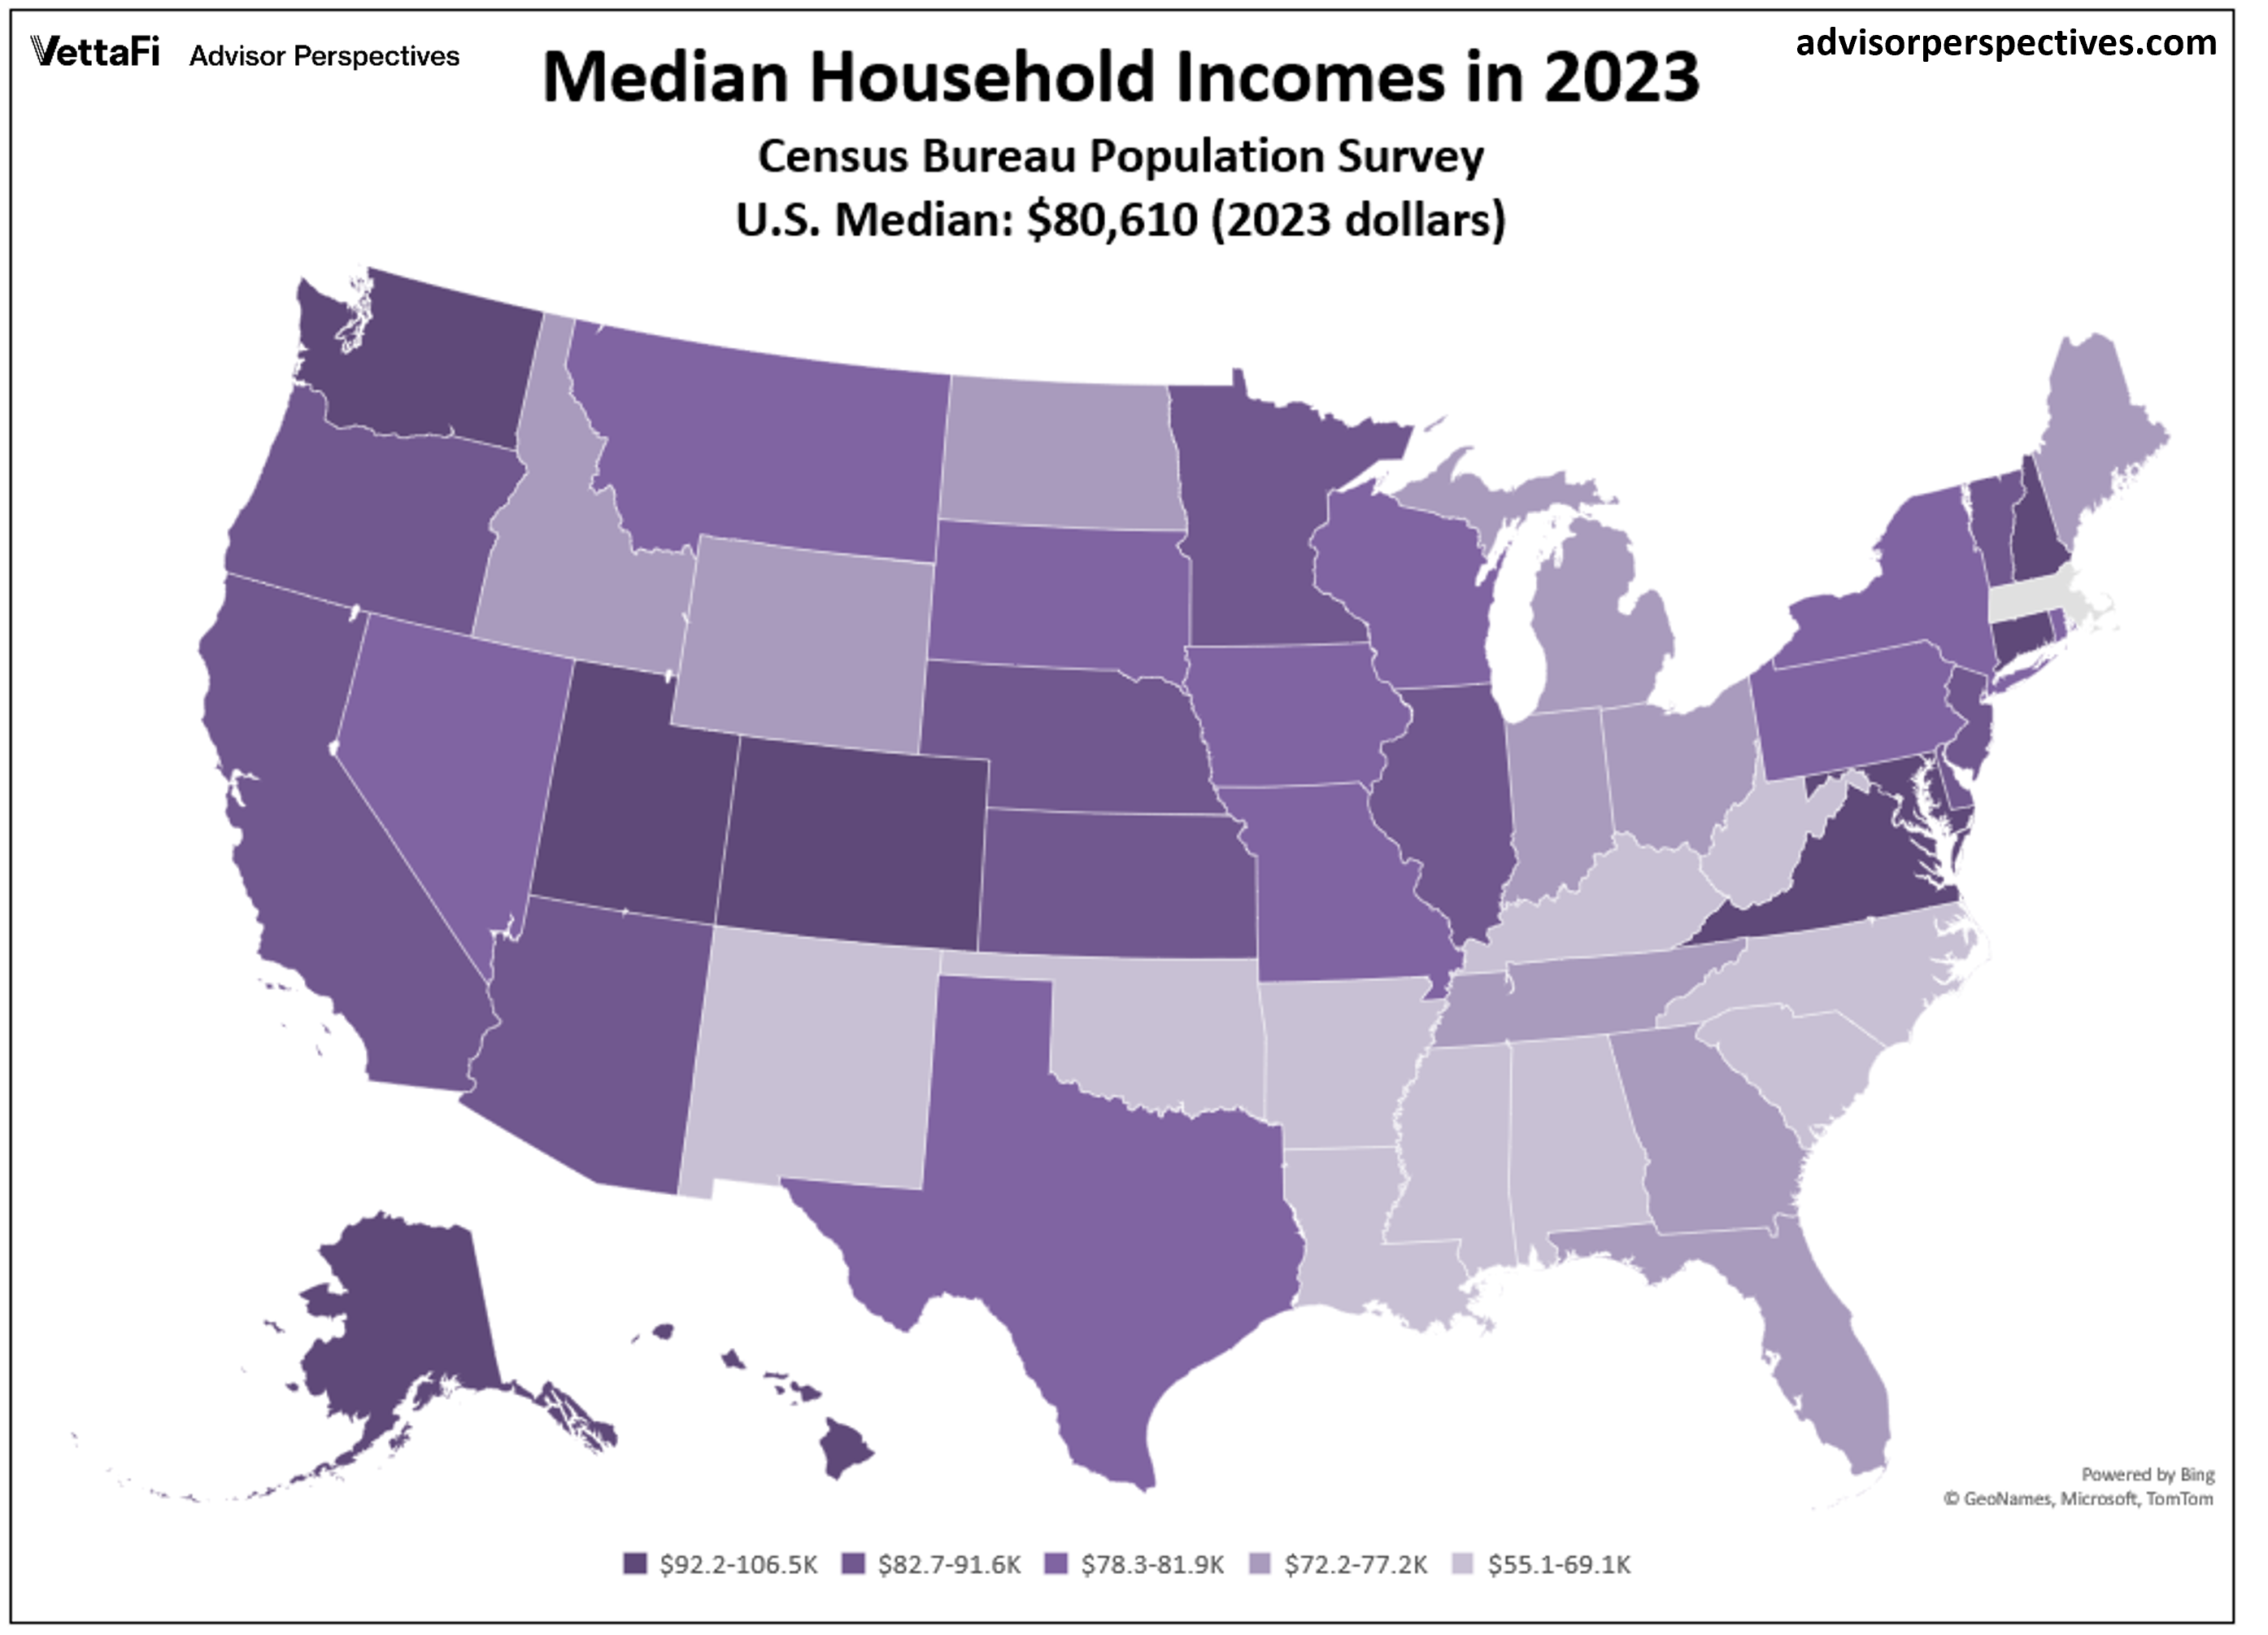
Here is the same map that color-codes the states based on median incomes quintile breakdown.
Of course, these estimates of purchasing power for the 50 states and DC aren't helpful in evaluating the cost of living for major metropolitan areas, which can differ dramatically from the state averages. Consider, for example, the cost of living in the District of Columbia, which is about 21% higher than neighboring Maryland and 36% higher than its southern neighbor, Virginia. A more extreme example is Manhattan in New York City compared to the rest of the region and state.