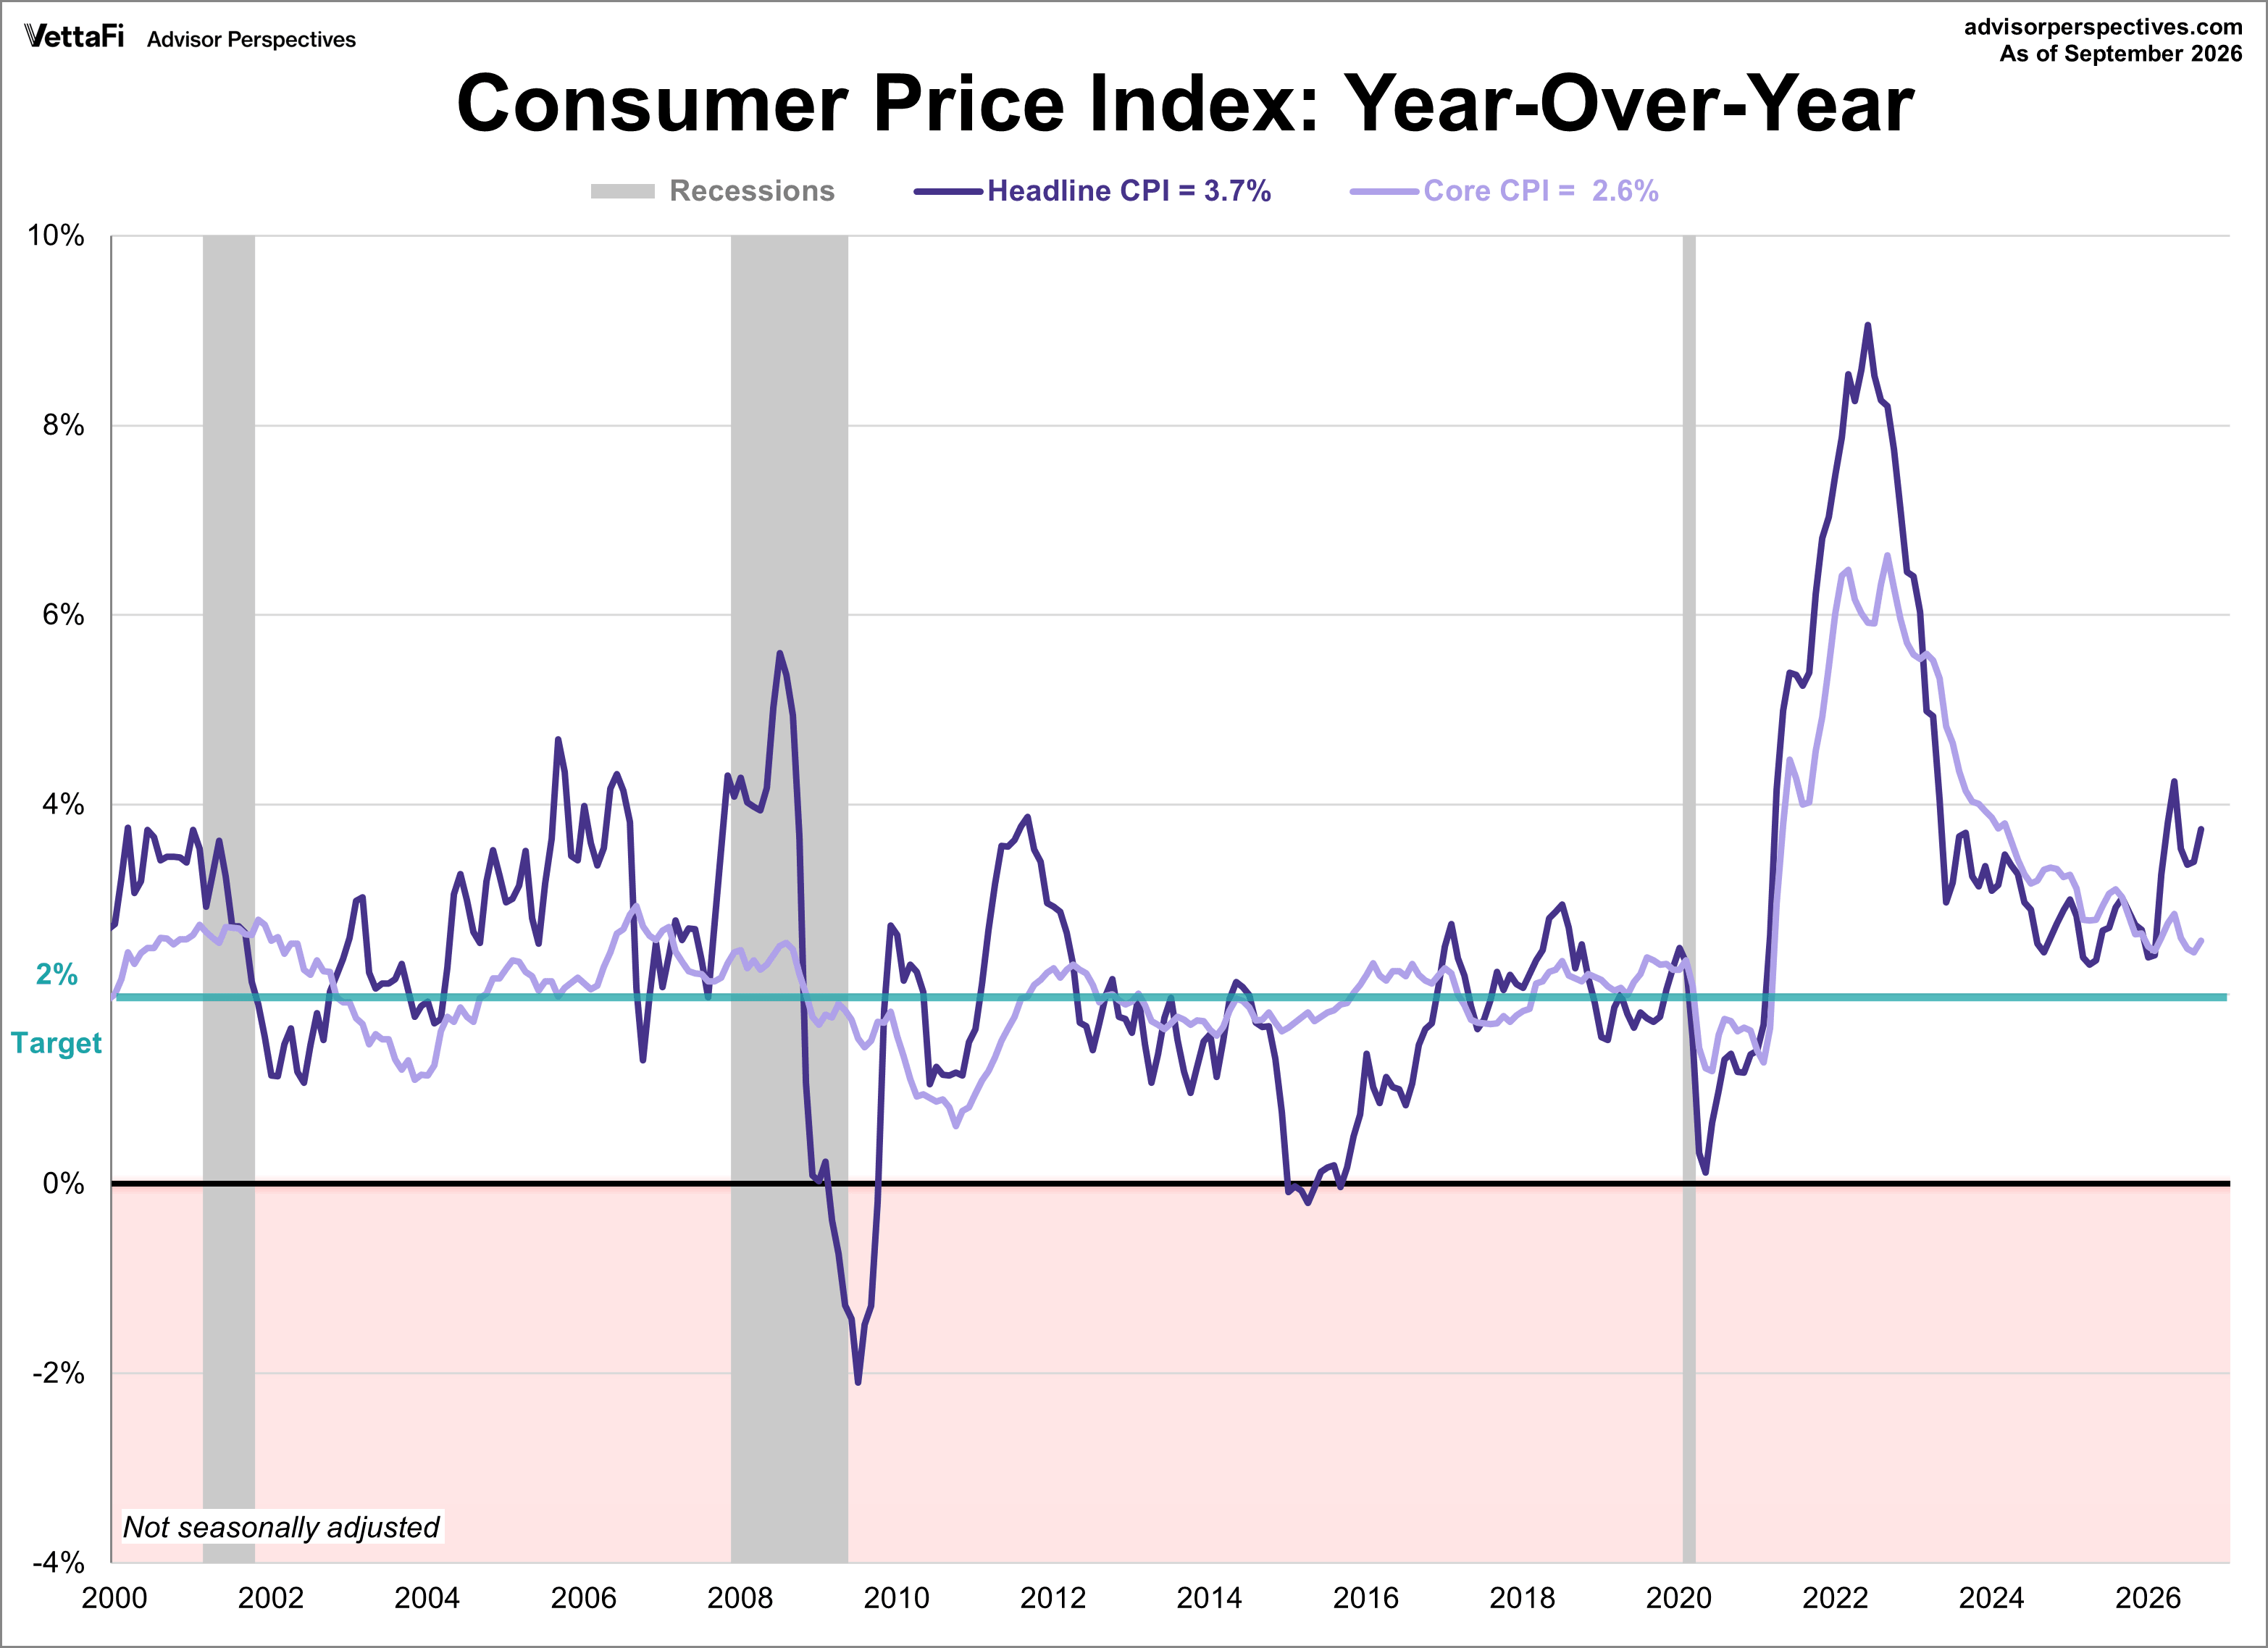
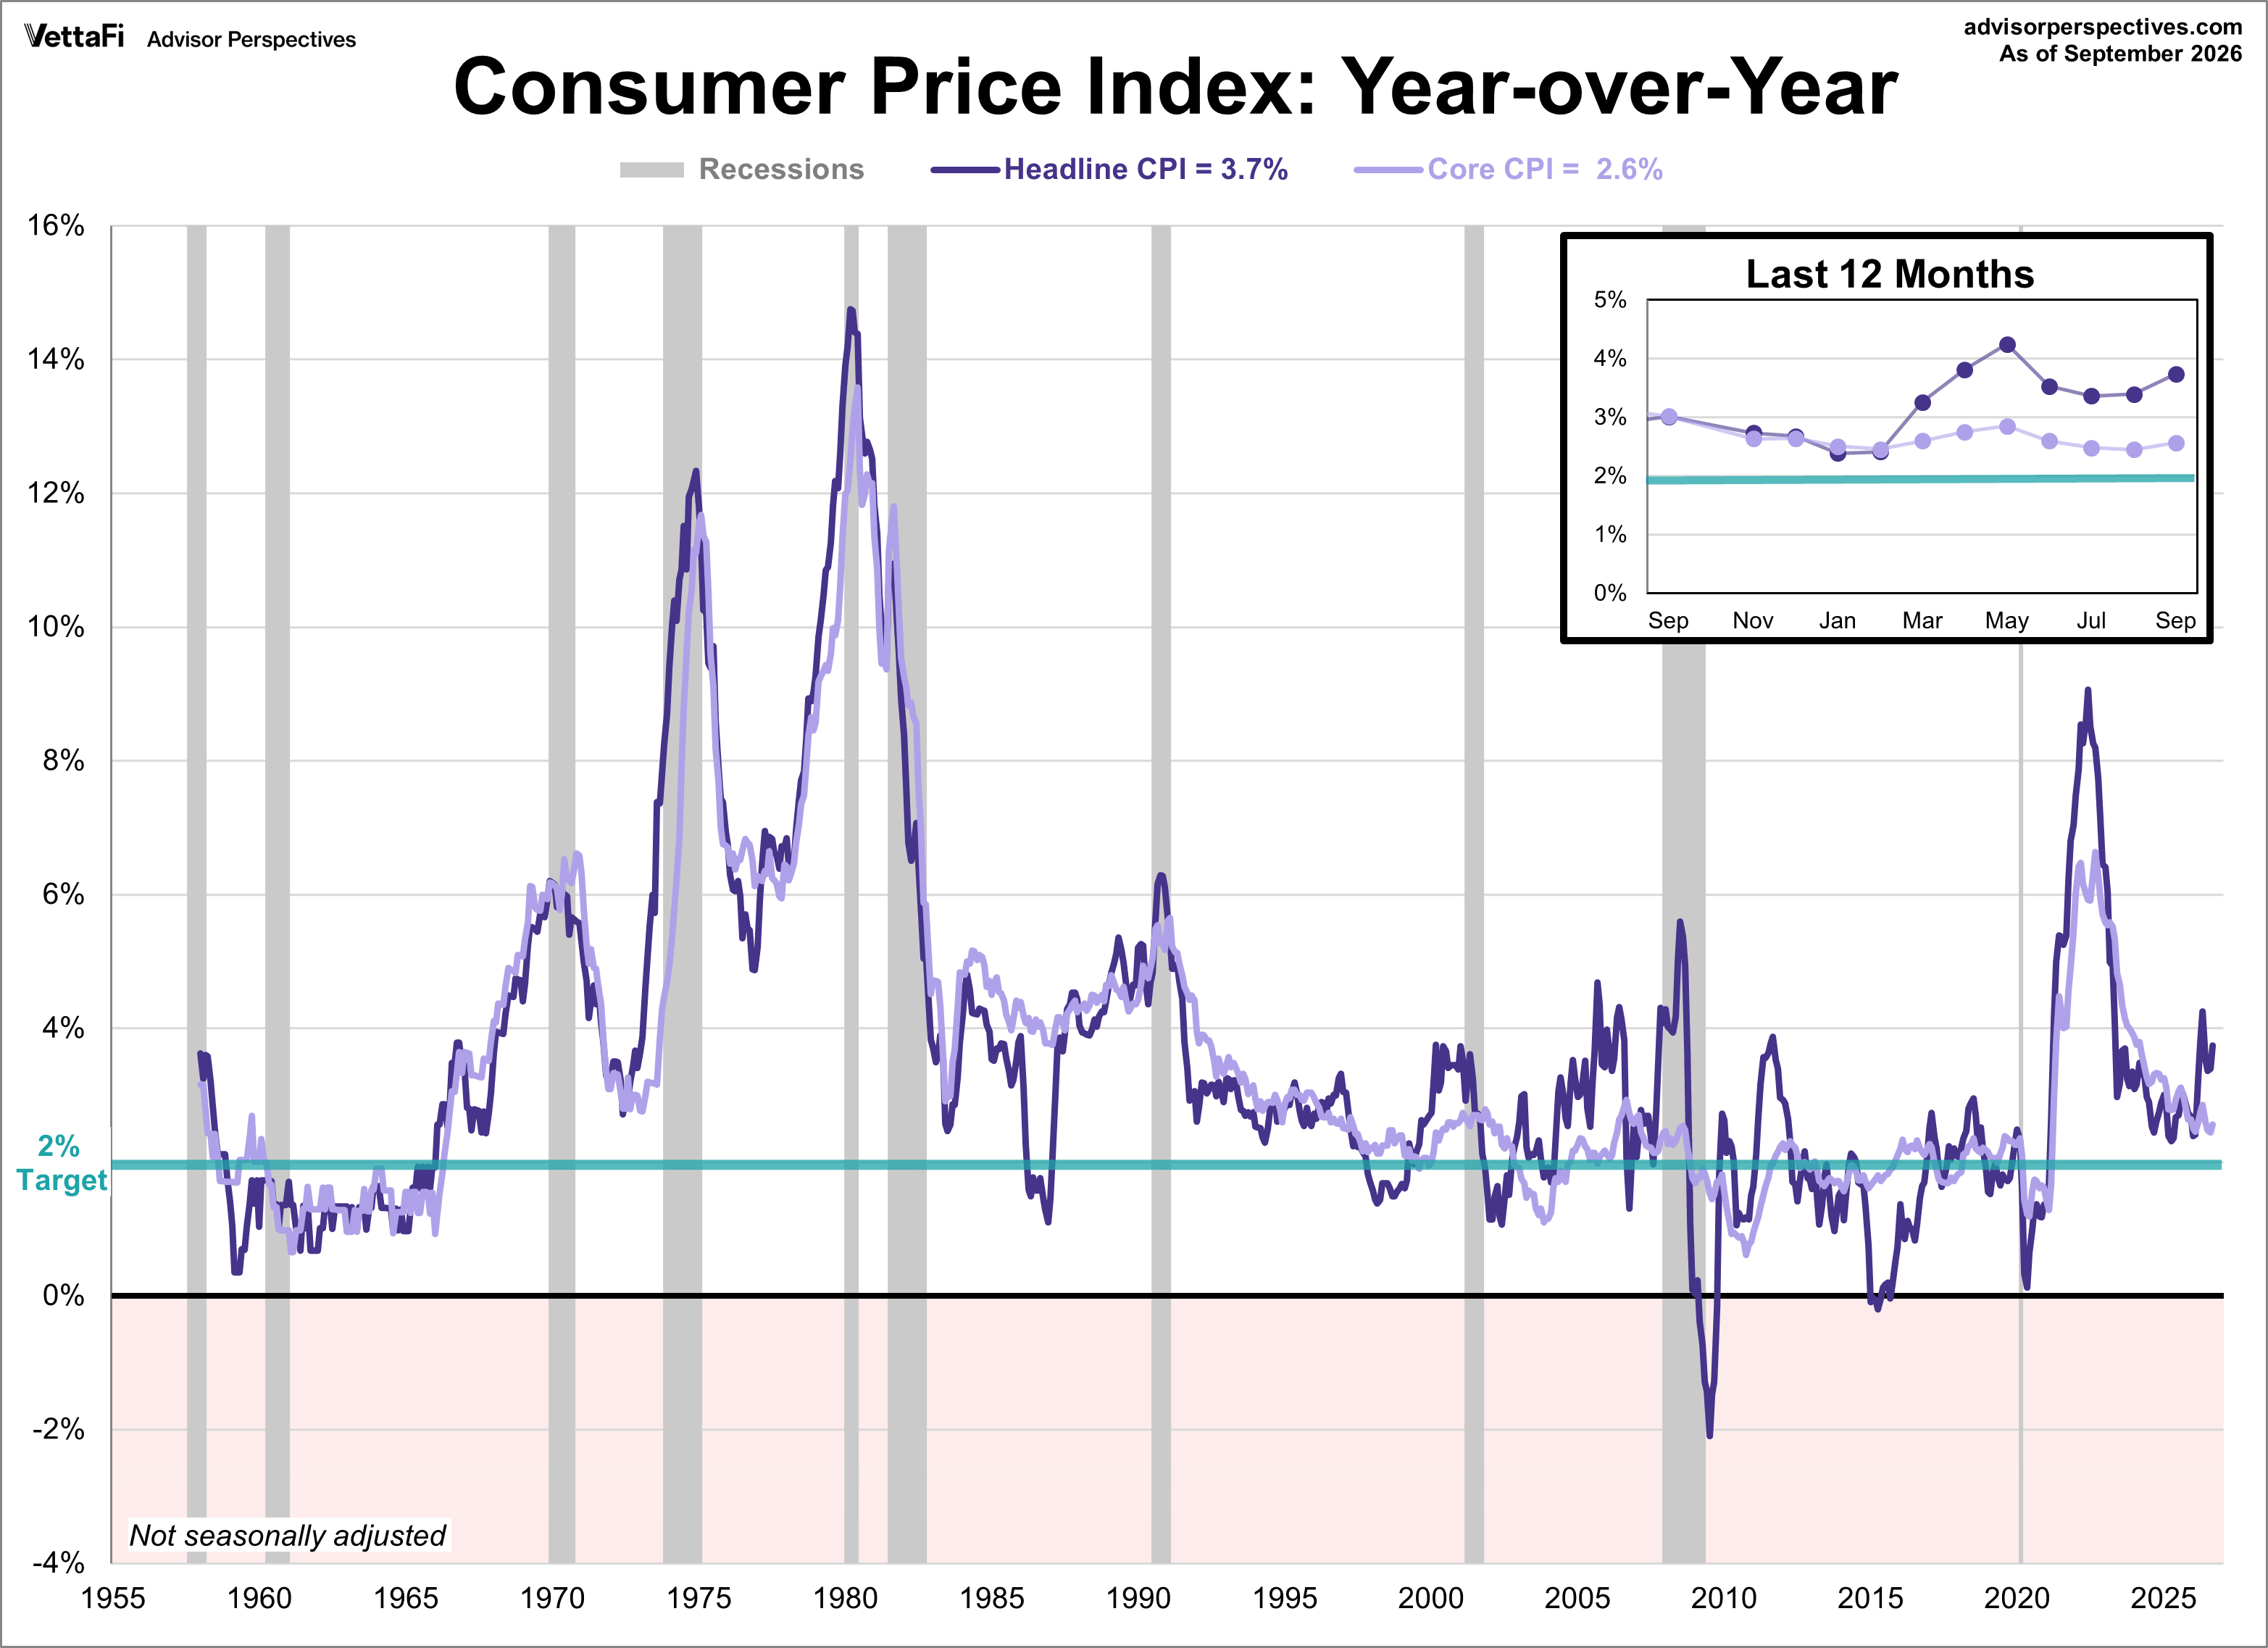
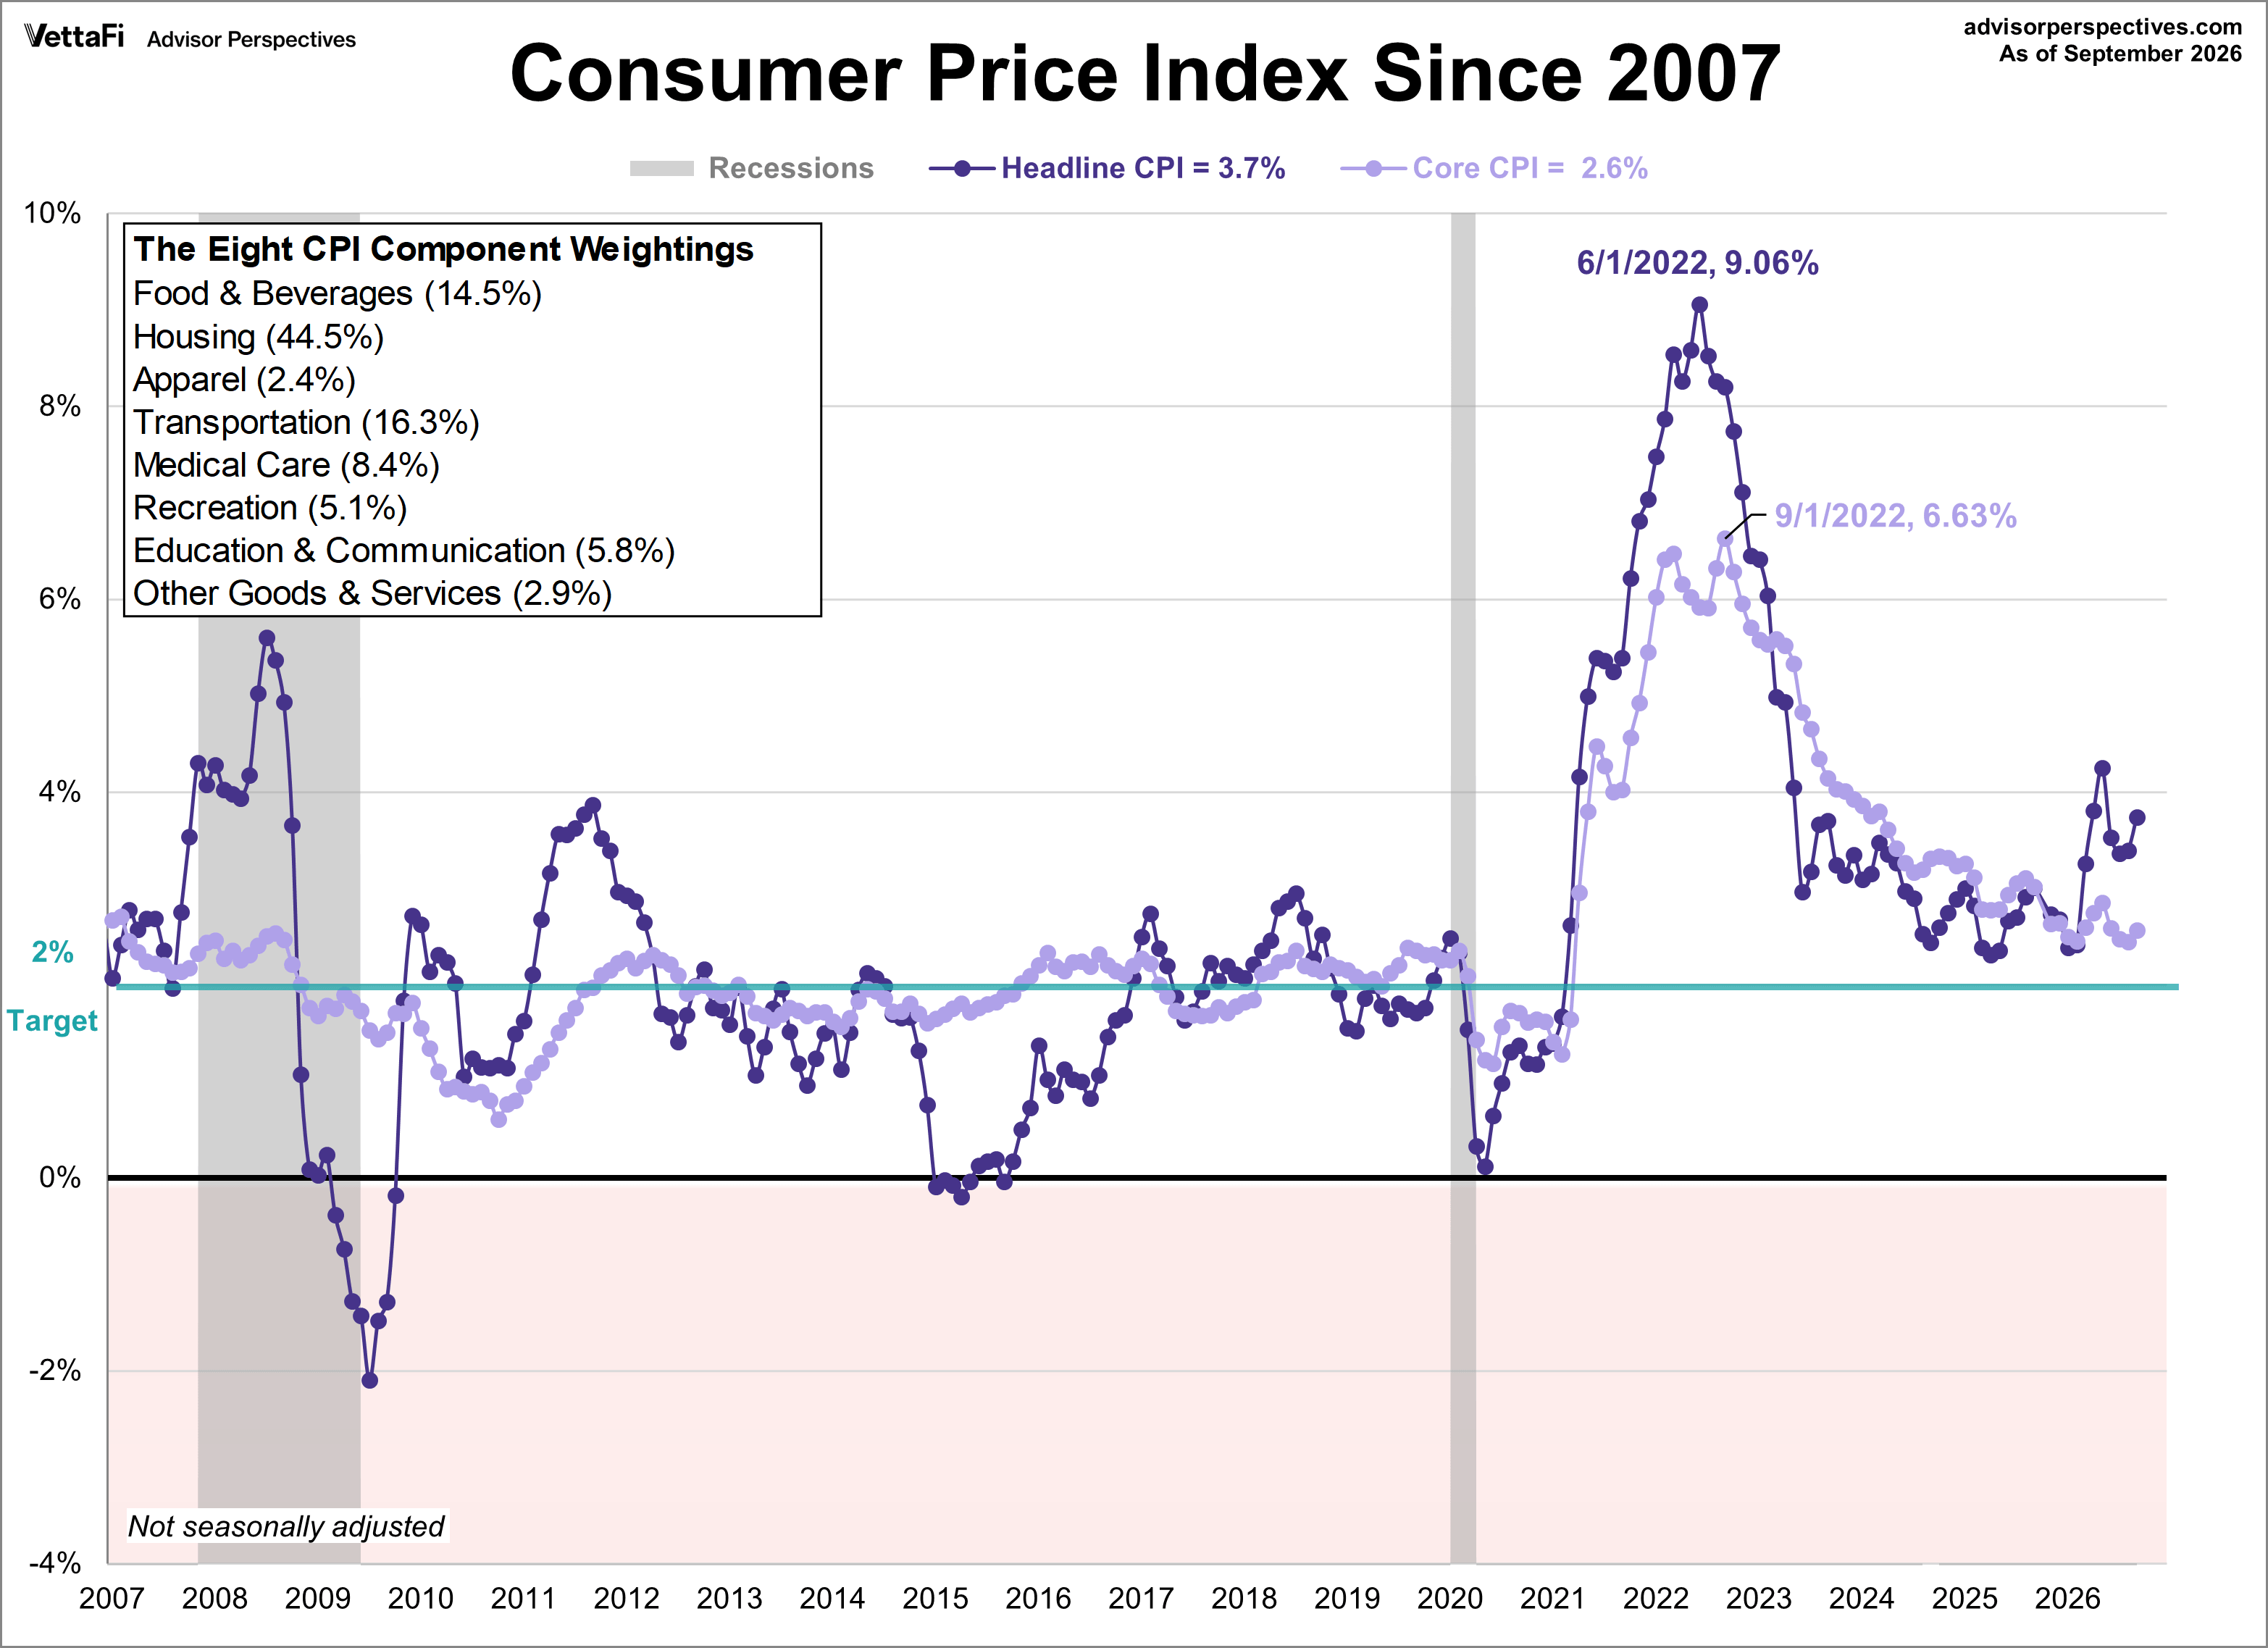
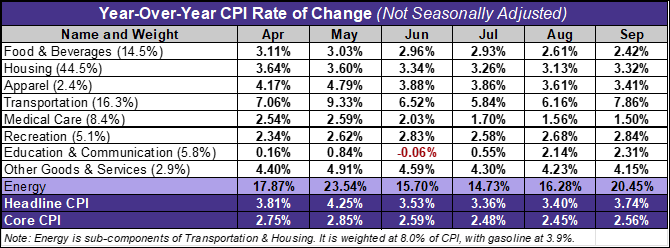
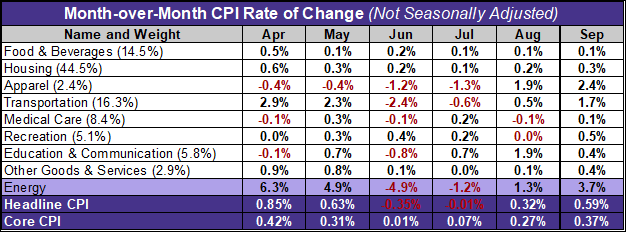
Inflation rose 3.7% year-over-year in September, climbing steadily higher from August's print of 3.4%. The headline figure for the Consumer Price Index (CPI) was also above economist estimates of 3.6%. On a monthly basis, consumer prices rose 0.6%, matching estimates. The increase was in large part driven by another jump in energy prices, as gasoline prices rose 9.1% — accounting for half the increase in the index.
On a "core basis," which excludes volatile food and energy prices, prices rose 2.6% year-over-year, slightly above forecasts of 2.5%, and rose 0.3% month-over-month. That was slightly above estimates of 0.2%.
Key Takeaways
- Headline inflation rose to 3.7% year-over-year while core inflation climbed to 2.6% in September.
- Headline prices rose 0.6% MoM from August, driven by a 9.1% spike in gasoline prices.
- Current market expectations show a 63% chance of a hold at the next Fed meeting versus a 37% chance of a 25 basis-point hike.
Here is the introduction from the BLS summary, which leads with the seasonally adjusted monthly data:
The Consumer Price Index for All Urban Consumers (CPI-U) increased 0.6 percent on a seasonally adjusted basis in September after rising 0.4 percent in August, the U.S. Bureau of Labor Statistics reported today. Over the last 12 months, the all items index increased 3.7 percent before seasonal adjustment.
The index for gasoline rose 9.1 percent in September, accounting for over half of the monthly all items increase. The energy index increased 5.2 percent over the month following a 2.1-percent increase in August. The shelter index rose 0.4 percent in September after rising 0.3 percent in August. The index for food was unchanged in September, as the index for food away from home increased 0.2 percent and the index for food at home fell 0.1 percent.
The index for all items less food and energy rose 0.3 percent in September, as it did in August. Indexes that increased over the month include recreation, used cars and trucks, education, airline fares, medical care, and apparel. Conversely, the index for communication was among the small number of major indexes that decreased in September.
The all items index rose 3.7 percent for the 12 months ending September, a larger increase than the 3.4-percent increase reported for the 12 months ending in August. The all items less food and energy index rose 2.6 percent over the year, following a 2.4-percent increase over the 12 months ending August. The energy index increased 20.4 percent for the 12 months ending September. The food index increased 2.5 percent over the last year.