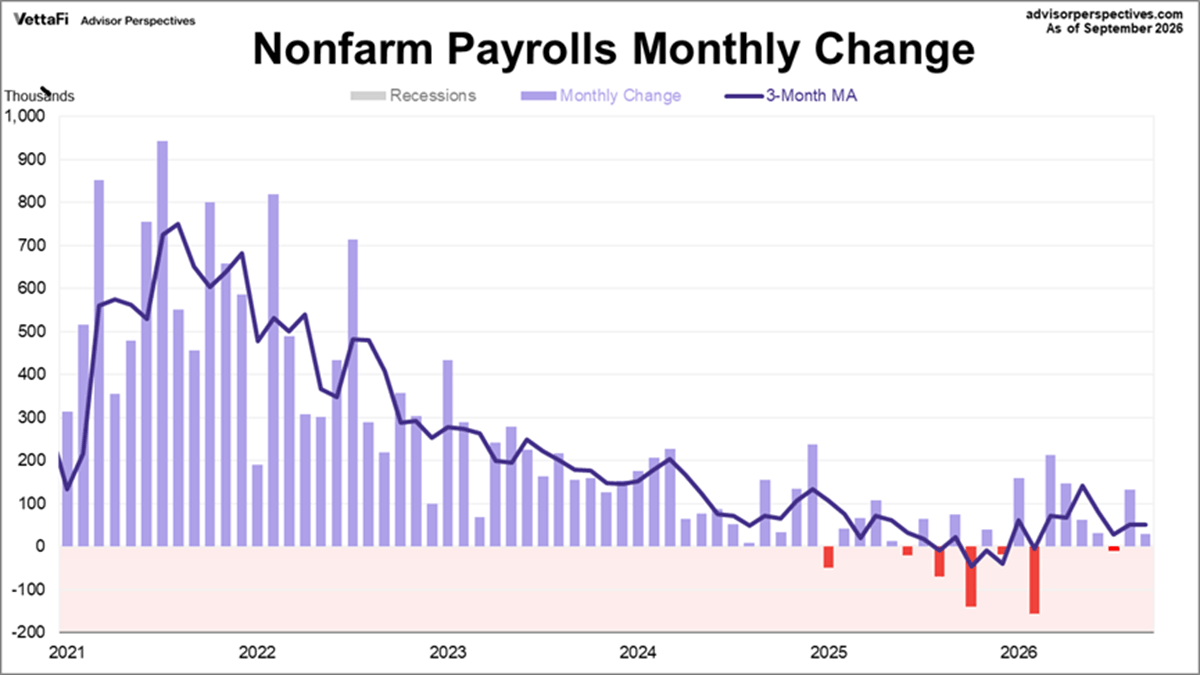
The latest employment report showed that 29,000 jobs were added in September, compared to August's 133,000 gain. This figure was significantly lower than the projected addition of 89,000 jobs. Meanwhile, the unemployment rate increased slightly from 4.1% to 4.2%.
Key Takeaways
- Nonfarm payroll employment added 29,000 jobs in September, below the forecast of adding 89,000 jobs.
-
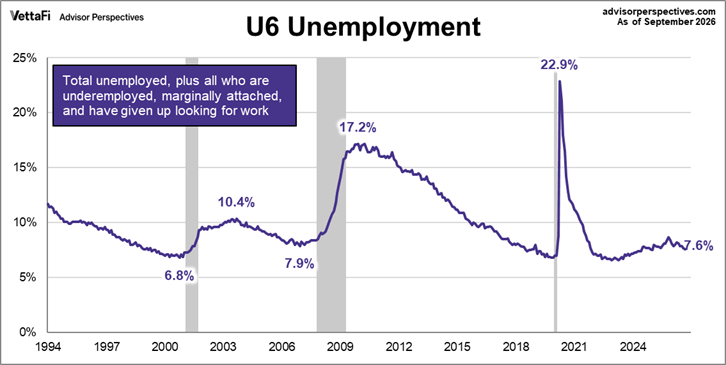
The unemployment rate increased slightly to 4.2% in September, while the U6 unemployment rate dropped to 7.6%.
-
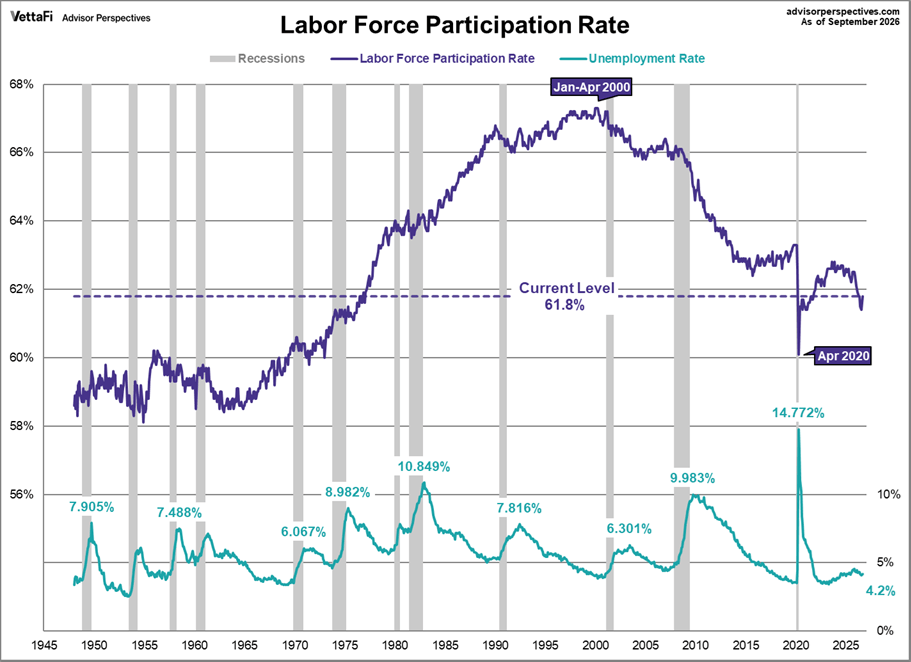
The labor force participation rate stands at 61.8%, increasing from 61.6% last month.
Here is an excerpt from the Employment Situation Summary released this morning by the Bureau of Labor Statistics:
Both nonfarm payroll employment (+29,000) and the unemployment rate (4.2 percent) changed little in September, the U.S. Bureau of Labor Statistics reported today. Employment in all major industries changed little over the month.
Household Survey Data: Both the unemployment rate, at 4.2 percent, and the number of unemployed people, at 7.1 million, changed little in September. The unemployment rate has remained in a narrow range of 4.1 percent to 4.3 percent since March.
Establishment Survey Data: Total nonfarm payroll employment changed little in September (+29,000), following an average monthly gain of 45,000 over the prior 12 months. Employment in all major industries changed little over the month.
Here is a snapshot of the monthly change in nonfarm employment over the last five years. The 3-month moving average is currently at 51,000.
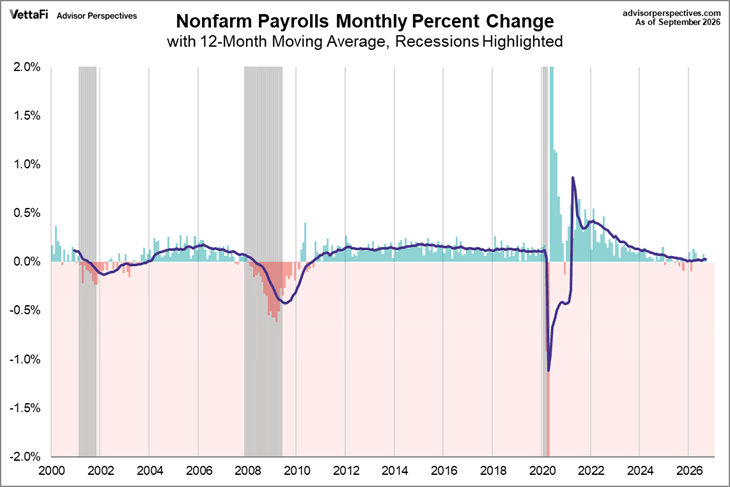
For another view, here is the monthly percent change in nonfarm employment since 2000. We've added a 12-month moving average to highlight the long-term trend. The latest 12-month moving average is at 41,000.
Unemployment, Recessions, and Market Trends
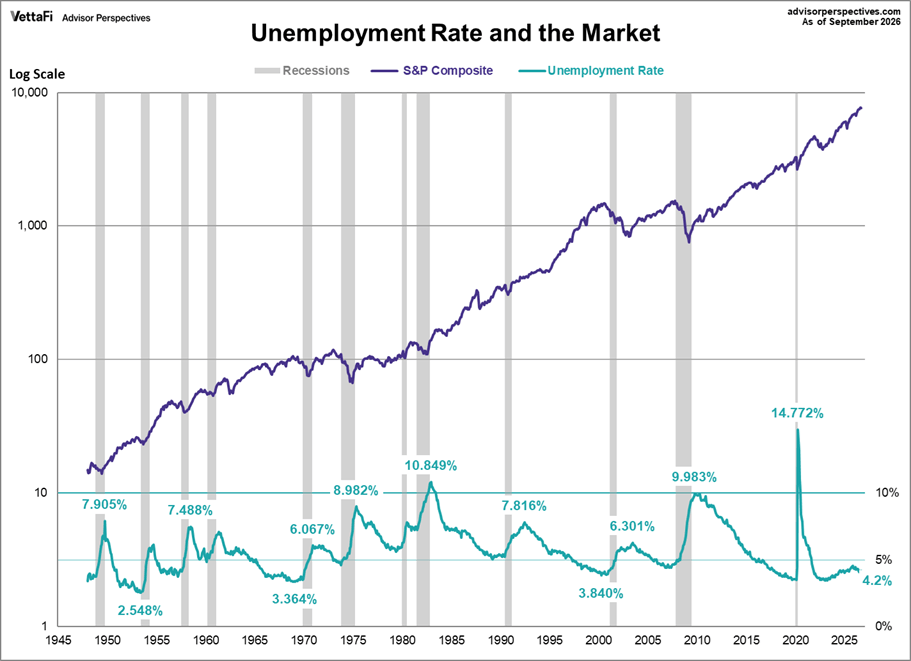
The next chart illustrates the relationship between unemployment, recessions, and the S&P Composite since 1948. Unemployment is typically a lagging indicator that moves inversely to equity prices (the top series in the chart). Notice the rising unemployment peaks in 1971, 1975, and 1982, which coincided with bear markets. A similar pattern briefly emerged during the COVID pandemic, but the impact was short-lived as irrational exuberance quickly took over. The latest unemployment rate stands at 4.175% (to three decimal places).
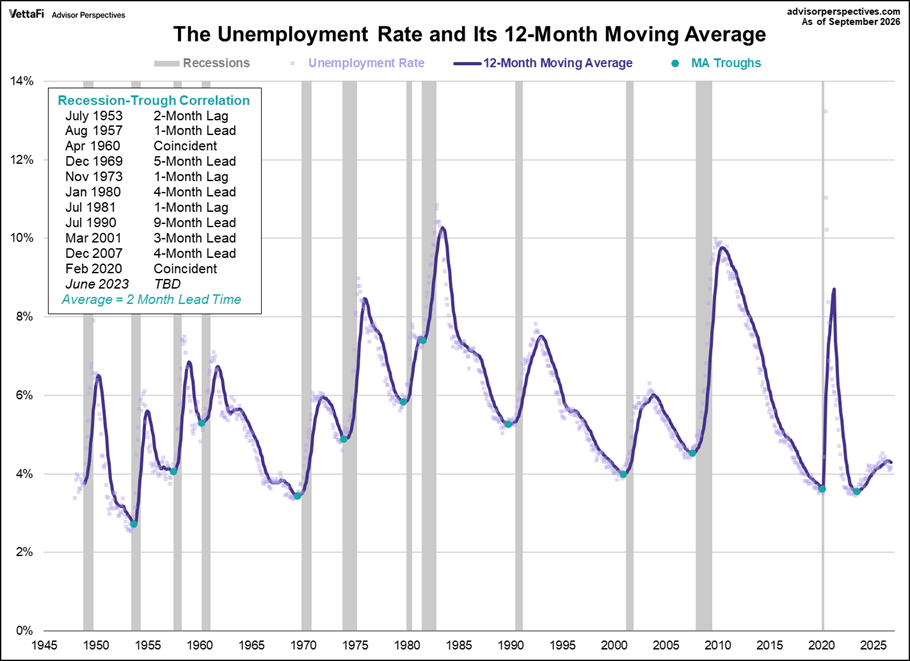
Now, let's examine the unemployment rate as a recession indicator—specifically, the cyclical troughs in the unemployment rate (UR). The next chart highlights a 12-month moving average of the UR, with its troughs marked.
Currently, the unemployment rate stands at 4.175%, just below the latest 12-month moving average of 4.300%. As shown in the inset table, the correlation between these moving average troughs and the start of recessions is remarkably strong. The most recent trough occurred 40 months ago, in June 2023, when the 12-month moving average of the unemployment rate fell to its lowest level since January 1970.
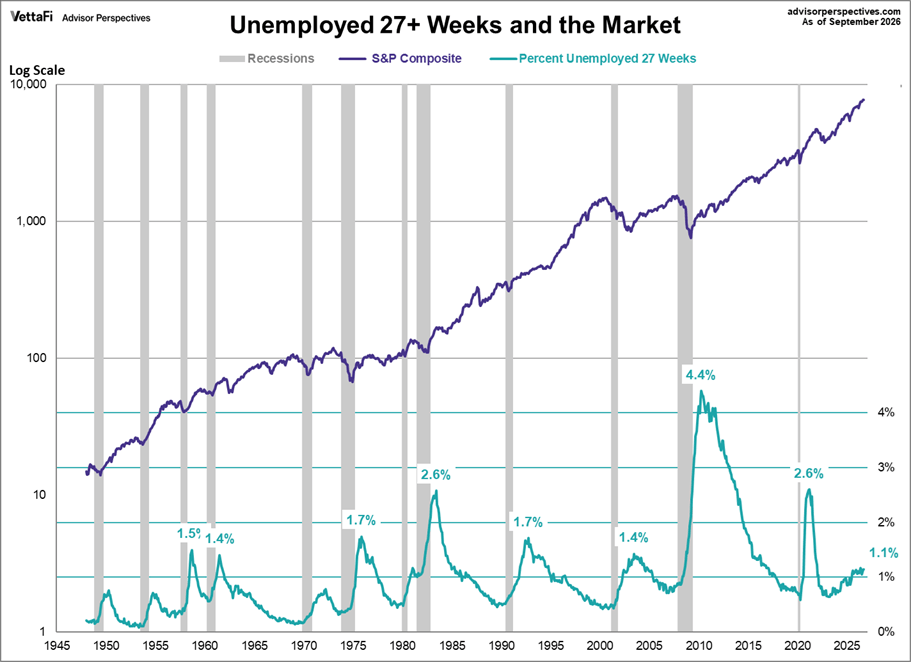
The next chart highlights the unemployment rate for those unemployed for 27 weeks or more. This rate has declined significantly from its all-time peak of 4.4% in April 2010. Following the COVID pandemic, it rose as high as 2.6% but quickly fell. This rate has recently been trending upwards and now stands at 1.1%.
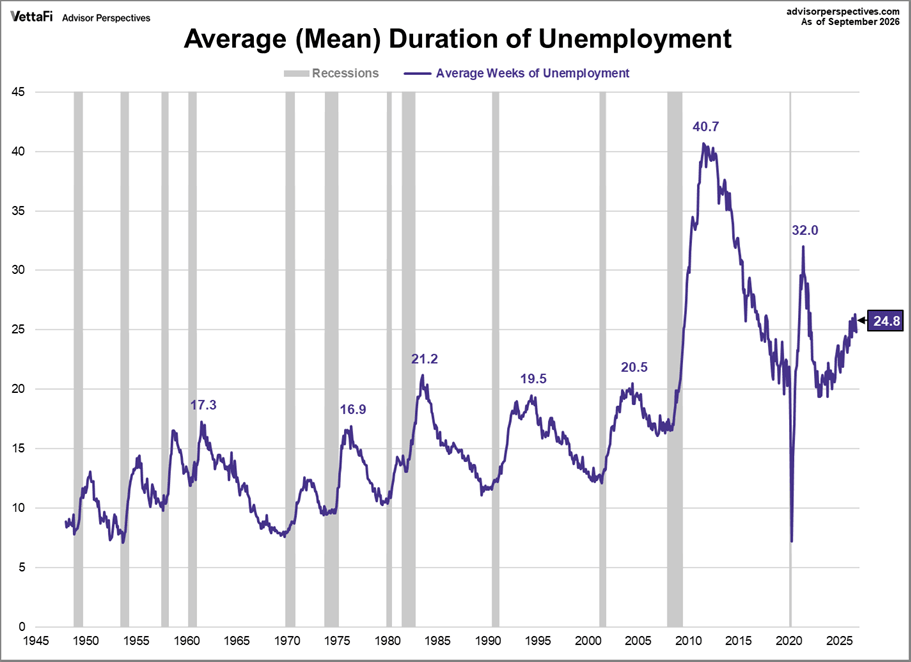
How long does unemployment typically last? As the next chart shows, the latest data indicates that the average duration of unemployment is 24.8 weeks. Historically, this metric tends to rise during and after recessions.
The Bureau of Labor Statistics’ broadest measure of unemployment, the U6 series, captures not only the unemployed but also the underemployed, marginally attached workers, and those who have stopped looking for work. Often referred to as the 'real' unemployment rate, many economists consider it the most comprehensive gauge of labor market conditions. In contrast, the more widely cited unemployment rate only includes those who are unemployed and actively job-seeking within the past four weeks. The U6 series currently stands at 7.6%, down from the previous month.