Key Points
- Valuation is often in the eye of the beholder; while the devil is in the details of the various popular tools.
- Shiller’s CAPE is a good long-term tool for gauging long-term returns; but not for short-term market timing.
- Traditional P/Es show less extreme valuations; but rising interest rates need to be considered.
Given that first quarter earnings season is largely in the books—and since it’s been a couple of years since I wrote comprehensively about valuation—I am tackling it again this week.
As has nearly always been the case and remains so today, ask a market bear about valuation and he’ll likely say the market is very expensive. Yet, ask a market bull about valuation and he’ll likely say the market is reasonably valued. How can that be? Assuming by “valuation,” we’re talking about price-to-earnings (P/E) ratios, the answer is in the eye of the beholder; and/or a function of the denominator (E, or earnings) you opt to plug in. There are three popular P/E ratios:
- Forward P/E (on subsequent 12-month earnings forecasts)
- Trailing P/E (on most recent 12-month past earnings)
- Robert Shiller’s Cyclically-Adjusted P/E (CAPE)
Since I’m most often asked about the CAPE, especially lately, let’s start there. The CAPE uses earnings from the prior 10 years and has become a widely followed valuation measure. Yale professor and Nobel Laureate Robert Shiller defines the numerator of the CAPE as the real (inflation-adjusted) price level of the S&P 500 Index, and the denominator as the moving average of the preceding 10 years of S&P 500 real reported earnings. The US Consumer Price Index (CPI) is used to adjust for inflation. The purpose of averaging 10 years of real reported earnings is to control for business cycle effects. The CAPE is also sometimes referred to as the P/E10.
The CAPE is a great tool to keep in the valuation toolbox when judging the likely long-term returns for the stock market. But where it can fall short is as a shorter-term market timing tool; especially by investors following it dogmatically.
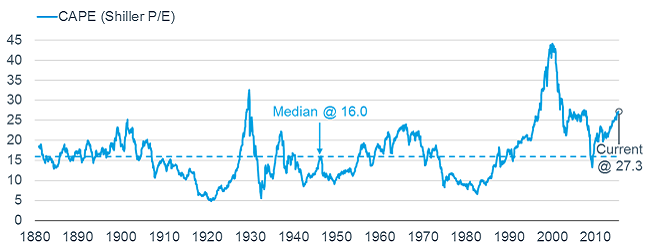
The chart below is of the CAPE—all the way back to the 19th century. Comparing today’s reading of 27 to the long-term median of 16 suggests the stock market is about 70% overvalued, assuming a mean reversion to the “norm.”
CAPE Signaling Stock Market Overvaluation

Source: Data and methodology courtesy of Professor Robert J. Shiller (http://www.econ.yale.edu/~shiller/data.htm), as of May 15, 2015.
CAPE Crusader
There are several well-documented problems with the construction of the CAPE; detailed in a still-highly-publicized 2011 report by Steve Wilcox for The American Association of Individual Investors (AAII), from which I’ll pull some of the data below.
In their classic 1934 book Security Analysis, Benjamin Graham and David Dodd noted that traditionally-reported P/Es can vary considerably because earnings are strongly influenced by the business cycle. To control for cyclical effects, Graham and Dodd recommended using multi-year averages of earnings. Shiller opted for a 10-year series.
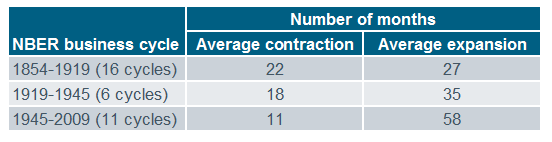
The problem with using a 10-year period for earnings is that the average US business cycle has been a lesser six years or so. More recently, recessions have become shorter (notwithstanding the “Great Recession” of 2007-2009), while expansions have become longer. You can see this in the table below. As a result, the CAPE tends to overestimate “true” average earnings during a contraction, and underestimate “true” average earnings during an expansion.
Source: National Bureau of Economic Research.
There are also problems with the deflator for the CAPE’s real earnings, since the Bureau of Labor Statistics frequently changes the manner in which the CPI is calculated. As such, there’s an apples-to-oranges problem using a static CPI within the CAPE.
Finally, both accounting standards and corporate taxation policies have changed significantly over time. Public accounting in the United States was still in its infancy in the late-1800s, and it’s questionable how useful these early earnings numbers are to any analysis using them as inputs.
More recently, the move toward fair-value accounting standards resulted in security losses having a devastating effect on the reported earnings of financial institutions during the 2008-2009 financial crisis. Yet that effect now appears to have been transitory. If an accounting item is deemed non-recurring, the common practice is to ignore it when determining underlying earnings (i.e., using “operating” instead of reported earnings). But the CAPE continues to reflect the effect of non-recurring items for the 10 years that follow their initial recognition in reported earnings.
Timing is everything
The punch line is that one has to question the validity of the CAPE long-term median when many of the major factors affecting reported earnings are peculiar to specific time periods. One final point: Even if you follow the CAPE as a valuation tool, be mindful of the simple fact that the stock market can become “overvalued” and stay that way for quite some time.
In the present bull market—now over six years old—the first month the CAPE crossed into overvalued territory (i.e., moved above its long-term median) was May 2009; just two months after the market’s bottom. Since then, the market is up nearly two-and-a-half times. Even more dramatic was the cross into overvalued territory by the CAPE in February 1991—nine years shy of the top of the great 1990s bull market.
But let me conclude this section with a comment of praise for the CAPE: It has a strong long-term relationship to subsequent 10-year stock market returns. I would not quibble with the notion that the market’s returns in the next 10 years could be lower than normal.
Traditional P/Es…shorter time frames
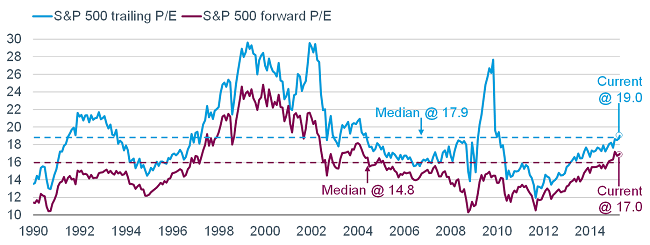
Two other common P/E ratios used to value stocks look at a shorter time frame for earnings. In the chart below are the forward and trailing P/Es; both relative to their long-term medians. Both are a bit above their medians, suggesting stocks are mildly overvalued—I would not quibble with that either.
Valuations Stretched, But Not Extreme
Source: FactSet, Standard & Poor’s, Strategas Research Partners LLC, as of May 15, 2015.
Although the S&P 500 is trading near an all-time high, it hasn’t made much headway so far this year. The elevation in the P/E has come from weak earnings growth—albeit not as weak as was expected heading into the quarter’s reporting season. In advance of the first quarter earnings season, the consensus of analysts’ expectations was for a drop of nearly 6% for the S&P 500. That has now moved to a gain of about 2%, which is a record-breaking improvement to earnings expectations. But, 2% is obviously not gangbusters, which means earnings are not doing the market’s heavy-lifting necessary when valuations get stretched.
But recent weak earnings growth needs a little dissection for clarity. Most of the weakness in the first quarter was concentrated in the energy sector—excluding energy, S&P earnings would have been up over 11% instead of the more paltry 2%; courtesy of strong earnings from the healthcare, financial and technology sectors (the latter two are sectors on which we have overweight recommendations).
Decent historical zone for P/Es re stock market gains
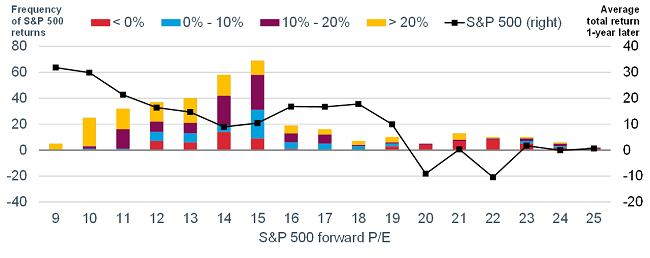
The chart below is a bit busy—and I apologize for that—but its data is interesting and I give credit to Barclay’s Capital, where I first saw the concept. The horizontal axis shows historic forward P/Es in zones from nine through 25 (zone nine would be every time the forward P/E had a nine “handle,” and so on). The black line, and related right-side vertical axis, shows the average S&P 500 return one year after P/Es were in each of these zones. The height of the bars—and color-coding within—and related left-side vertical axis, shows the frequency the market performed in specified ranges.
Clearly, the best returns for the stock market (and the highest ratio of >20% returns) came after P/Es were in their lowest zone. Not surprisingly, the worst returns occurred following P/Es that were north of 20.
But, as you can see, when the forward P/E had a handle ranging between 16 and 18 (a range in which we sit presently), the stock market was up double-digits and had no subsequent negative one-year returns. This is where the “past performance is no guarantee of future results” qualifier is necessary of course.
16-18: Not a Bad P/E Area Historically
Source: Barclay’s Capital Inc., FactSet, Strategas Research Partners LLC. 1985-April 30, 2015.
Equity valuation in the context of bond yields
Finally, there is the relationship between stock prices and bond yields worth discussing. This is especially relevant given Fed Chair Janet Yellen’s recent comments that valuations in the stock market were “quite high” and that there was a risk of a “sharp jump” in long-term bond yields when the Fed raises short-term rates.
Interest rates are an important input to pricing equities—taking the present value of the future stream of earnings and discounting by the risk-free rate (typically the 10-year Treasury yield). To that, you need to add the “risk premium,” which relates to the risk of buying stocks over bonds.
If the discount rate is going down, investors will typically pay more for earnings and vice versa. With yields now moving higher, companies will require stronger earnings growth to support current stretched valuations. This is one of the reasons we are more cautious on US stocks this year relative to most of the past six years.
Important Disclosures
The information provided here is for general informational purposes only and should not be considered an individualized recommendation or personalized investment advice. The investment strategies mentioned here may not be suitable for everyone. Each investor needs to review an investment strategy for his or her own particular situation before making any investment decision.
All expressions of opinion are subject to change without notice in reaction to shifting market conditions. Data contained herein from third party providers is obtained from what are considered reliable sources. However, its accuracy, completeness or reliability cannot be guaranteed.
Examples provided are for illustrative purposes only and not intended to be reflective of results you can expect to achieve.
(0515-3895)
© Charles Schwab
© Charles Schwab
Read more commentaries by Charles Schwab