Key Points
-
Stocks continue to buck every variety of negative news.
-
Melt ups don’t tend to end well, but so far the fundamentals remain supportive.
-
Underneath the surface have been increasing rotations—a healthy occurrence, for now.
Over the course of the past year, we have often listed a melt up as one of the “risks” the market faces. It’s been categorized as a “risk” based on the history of melt ups—as good as they feel while they’re occurring, they have typically not ended well. Melt ups tend not to peter out, but to instead end with a bang; and timing the crescendo is extremely difficult.
Teflon market
Stocks have persistently defied the skeptics, who have pointed to political dysfunction, monetary policy uncertainty, and potential geopolitical crises as reasons for woe. President Trump, on the other hand, has consistently touted the stock market and taken credit for its steady ascent over the past year. We believe it’s been the actual fundamentals—which are global in nature—that have driven the extraordinarily calm surge in stocks. Paramount among those fundamentals is the fact that all 45 OECD countries are growing; with about two-thirds experiencing accelerating rates of growth. Couple that with the start, in mid-2016, of a sharp turn-for-the-better in U.S. corporate earnings growth (aided by the aforementioned strong global growth), and you have the recipe for yet another leg up in the ongoing secular bull market which began nearly nine years ago.
In fact, the following major countries’ stock markets have outperformed the S&P 500 so far this year: China, France, Germany, Hong Kong, India, Italy, Japan, and Spain. This has resulted in outperformance by both the MSCI EAFE (developed international) and MSCI EM (emerging markets) indexes so far this year. I’m not sure President Trump can take credit for that.
Shades of 1995
The lack of drama in the U.S. market—at least on the surface—has been remarkable. I’ve recently been asked several times by clients and other investors whether there have been years in history that highly resemble 2017 to-date. Bespoke Investment Group (BIG) has been tracking the correlation between this year and past years, and the latest data puts 1995 at the top of the ranking. For what it’s worth, seven of these top-10 correlated years occurred within secular bull markets (1995, 1954, 1958, 2013, 1964, 1997 and 1955). In addition, notice that most of the highly correlated years had significantly higher year-to-date performance than what we’ve seen this year.
Source: Bespoke Investment Group, as of December 1, 2017.
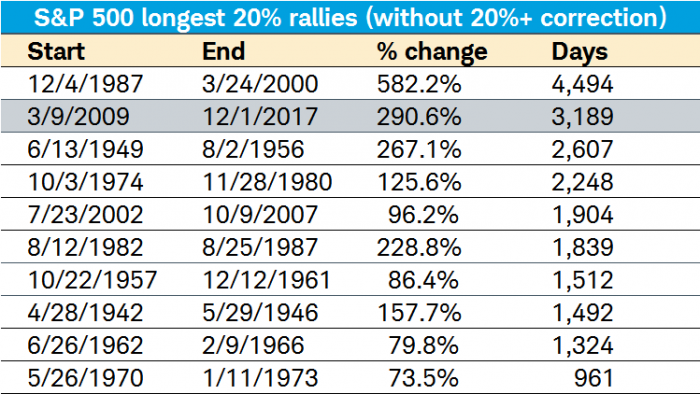
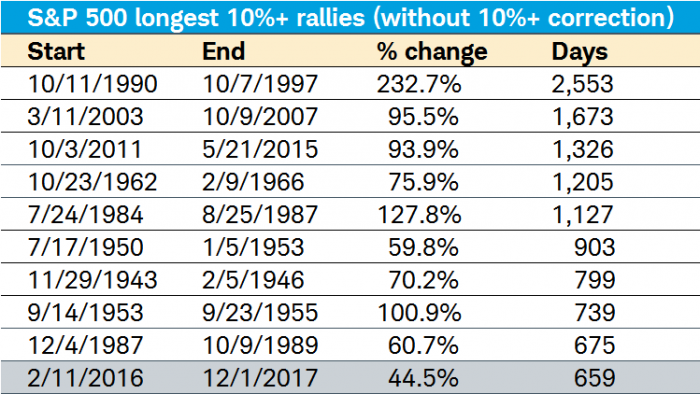
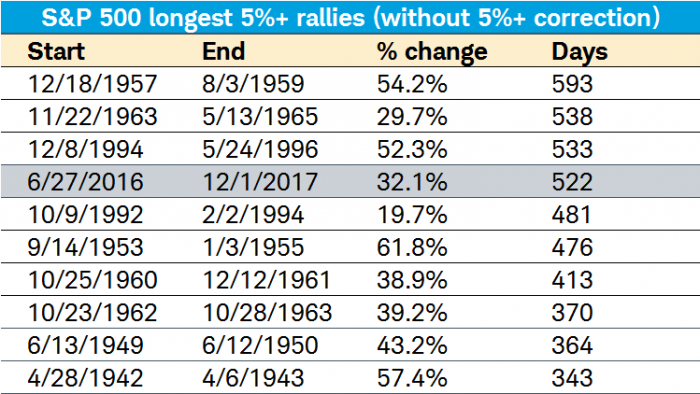
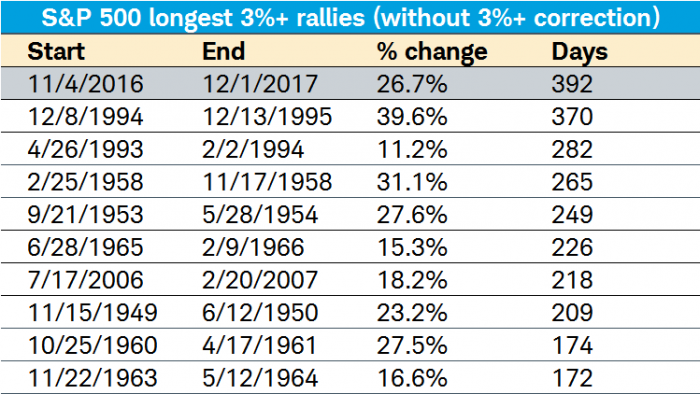
Elongated streaks
As you can see in the tables below, the S&P 500 is in its second-longest bull market in history (using the simple 20% rule). It’s the 10th longest streak without a 10% correction; the fourth longest streak without a 5% pullback; and the longest streak in history without a 3% pullback.

Source: Bespoke Investment Group, Bloomberg, as of December 1, 2017.
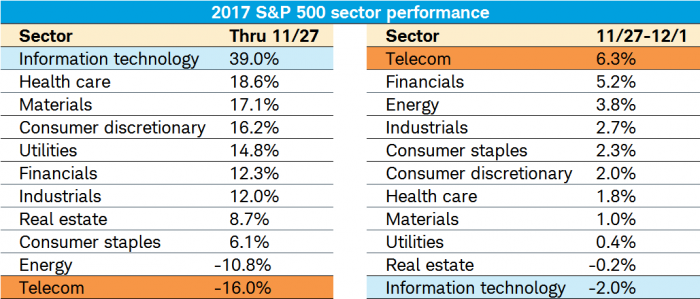
Rotations rule
But hidden beneath these extraordinary statistics is some notable rotation recently—perhaps a healthy way for the market to consolidate some gains without the overall market suffering to any significant degree. The tables below compare S&P 500 sector performance over two time periods—year-to-date through November 27 and the short period between November 27 and December 1. I chose November 27 because the following day began the swift reversal of tech stocks from their leadership perch, among other notable sector reversals.
Source: Bloomberg, as of December 1, 2017.
Cornerstone Macro highlighted just how unique some of these reversals have been over the past week:
- The circumstance where technology stocks were down 2% or more in a calendar week, while industrial stocks were up 2% or more is so rare that it only occurred eight other times since S&P GICS sector data began in September 1989; an incidence rate of 0.54%.
- The circumstance where technology stocks were down 2% or more in a calendar week while the S&P 500 advanced 1.5% or more is so rare that it only occurred three other times since GICS data began; an incidence rate of 0.27%.
There have been some other notable characteristics behind the rotations we’ve been seeing. According to BIG, through Thanksgiving this year the stocks that had performed best were growthier stocks with low or no dividend yields, those with heavy international revenue exposure, and those with low short interest. Value stocks with high dividend yields and low price/earnings (P/E) ratios had been the year’s worst performers. In the past week, reversals generally occurred among all of those traits.
No bad breadth
All that said, the good news for the market generally is that breadth overall remains healthy. Looking a level down from sectors, the percentage of S&P 500 industry groups with rising 200-day moving averages (DMAs) remains near a four-year high at 87.5; while the percentage with rising 50-DMAs is also a healthy 83.3. That puts 87.5% of industry groups above their 200-DMA; and 95.8% above their 50-DMA. The net is that the market has broadened out; and it’s no longer just technology powering ahead.
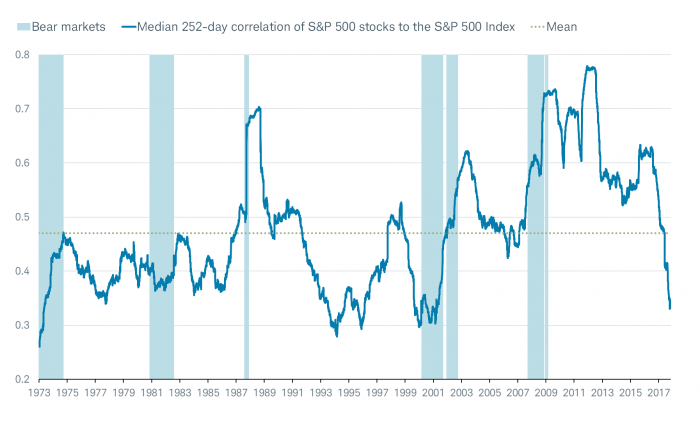
This analysis is in keeping with the theme of crashing correlations about which we’ve been writing for some time. Benefitting the ability to “sell” diversification to investors as an important portfolio discipline—and also leveling the playing field for active managers vs. passive indexes—has been a true crash in correlations. Specific to the U.S. equity market, the chart below shows just how dramatic this plunge in correlations has been over the past year. This simply means there’s been less lemming-like behavior by stocks; and instead there’s been much more dispersion among individual stocks.
Crashing correlations
Source: Ned Davis Research (NDR), Inc. (Further distribution prohibited without prior permission. Copyright 2017© Ned Davis Research, Inc. All rights reserved.), as of December 1, 2017. Bear markets represent S&P 500 declines of 20% or more. Median 252-day rolling correlation of 1-day returns.
For now, I’m finding solace in the fact that there have been rotational “corrections” even if we haven’t yet had a full-blown corrective phase. Melt ups can be fun while they’re underway; but they don’t tend to end well, and it’s tricky to time the inevitable failure. Discipline is more important now than it’s been in quite some time.
Important Disclosures:
The information provided here is for general informational purposes only and should not be considered an individualized recommendation or personalized investment advice. The investment strategies mentioned here may not be suitable for everyone. Each investor needs to review an investment strategy for his or her own particular situation before making any investment decision.
All expressions of opinion are subject to change without notice in reaction to shifting market conditions. Data contained herein from third-party providers is obtained from what are considered reliable sources. However, its accuracy, completeness or reliability cannot be guaranteed.
Examples provided are for illustrative purposes only and not intended to be reflective of results you can expect to achieve.
©2017 Charles Schwab & Co., Inc. All rights reserved. Member SIPC.
© Charles Schwab
Read more commentaries by Charles Schwab