Key Points
-
Earnings and the beat rate for 4Q18 continue their strong stretch; but the “math” gets trickier this year as the year-over-year boost from corporate tax cuts fades.
-
Lowered guidance could be setting the bar sufficiently low this quarter for companies to be able to scale—typically a bullish set up for stocks.
-
However, if earnings head into a recession, last year’s drawdown may not have been sufficient to price in those lower expectations (especially if an economic recession is near).
Given that we are about two-thirds of the way through fourth quarter 2018 earnings reporting season I thought it was time for an update. In keeping with one of my overall themes over the past year that trends matter at least as much as levels, the possible coming inflection point from strongly positive earnings growth in 2018, to much weaker (and even possibly negative) results this year is worth further analysis.
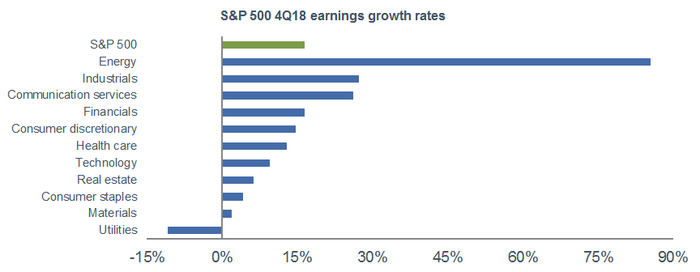
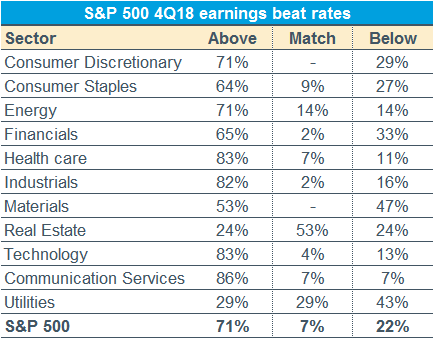
First, let’s take a look at the fourth quarter 2018 (4Q18) results for the S&P 500 so far this season. As of Friday’s close, earnings growth is expected to be 16.5% for the fourth quarter; which is a blend of the 67% of already-reported earnings and the 33% of estimates for those not-yet reported. The “beat rate” relative to consensus so far is 71%, with 7% matching and 22% coming in below estimates. As you’ll see in the two charts below, the energy sector accounts for the largest contribution to fourth quarter earnings growth, with utilities the only sector showing earnings deterioration. From a beat rate perspective, Communication Services, Technology, Health Care and Industrials top the list, with utilities bringing up the rear.
4Q Earnings Growth/Beat Rate by Sector

Source: Charles Schwab, I/B/E/S data from Refinitiv, as of February 8, 2019.
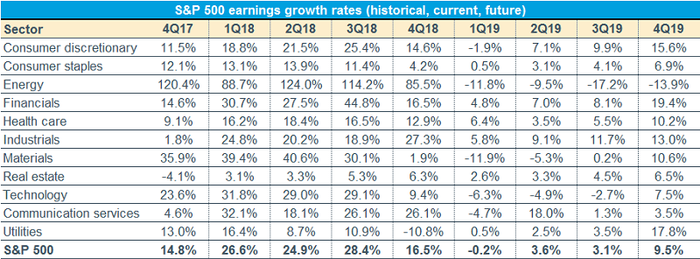
There is no question that last year was a banner year for earnings growth; with the full year likely coming in around 24%, which is nearly double the 12.8% rate of growth in 2017. We can thank the corporate tax cut for that jump; but as we’ve been noting for some time, the math “stops working” this year. Starting in this year’s first quarter, the comparison is to last year’s first quarter, which was the first quarter in which the tax cuts took effect. In addition, there have been additional weights on earnings expectations, including slower global growth, the government shutdown, last year’s plunge in oil prices, last year’s strength in the U.S. dollar, and the trade-related weakness in capital spending.
As such, you can see in the (admittedly-busy) table below, the consensus expectation for first quarter 2019 (1Q19) growth is now in slight negative territory; with the subsequent two quarters in low-single digit territory.
Source: Charles Schwab, I/B/E/S data from Refinitiv, as of February 8, 2019.
On the one hand…
After a spell in 2018 of companies seeing their stock prices hammered even alongside better-than-expected earnings; in general so far this year, stocks’ action upon announcing stronger-than-expected earnings has been stellar. So far this season, companies beating on both revenues and earnings are outperforming the overall market; while those missing on both revenues and earnings are not underperforming as significantly as is the historical norm (or was the case last year).
On the other hand…
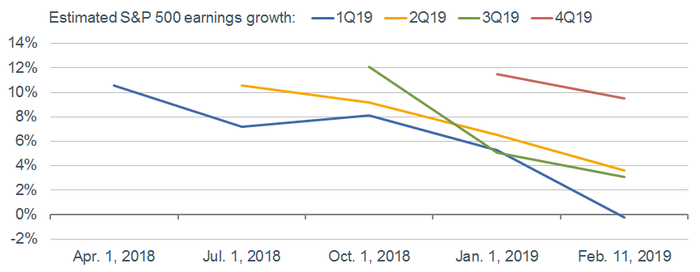
The 4Q18 earnings beat rate of 71% is below the past four-quarter average beat rate of 78%, but above the 64% average since 1994. On a revenue basis, the 4Q18 beat rate of 61% is below the past four-quarter average beat rate of 72%, but above the 60% average since 2002. In terms of forward guidance, S&P 500 companies lowering guidance for 2019 outnumber companies raising guidance by 2.6-to-1. But this more tepid outlook is not new. As you can see in the chart below, for all four quarters’ estimates this year, since consensus estimates for the S&P 500 began getting published by Refinitiv last April, the trends have been decidedly down. For this year’s first quarter, estimates have moved from more than 10% last April to slightly negative today. I track these estimates on a daily basis, and my fear is that the downgrades to estimates are not finished.
Earnings Estimates for 2019 in Descent
Source: Charles Schwab, I/B/E/S data from Refinitiv, as of February 8, 2019.
That said…
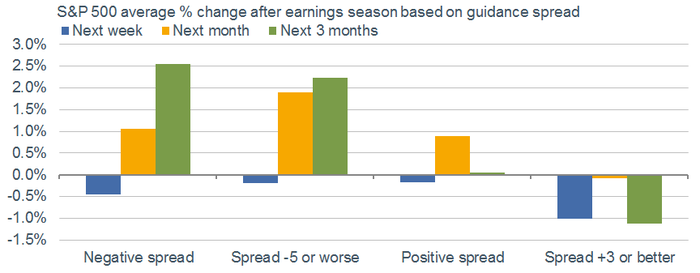
Is negativity about earnings growth in the future necessarily a bad thing from a stock market perspective? Given myriad macro and micro risks these days, it’s no surprise that companies have been tempering expectations. As shown in the chart below from Bespoke Investment Group (BIG), there is historical evidence that this type of negative guidance set-up can be bullish for the stock market in the near-term once earnings season comes to an end. As shown, the S&P 500 averaged declines in the week after earnings season ended under all scenarios; but the performance was stronger over the subsequent month and three months when the guidance spread was negative vs. when it was positive.
Negative Guidance Not Necessarily Market Negative
Source: Charles Schwab, Bespoke Investment Group. October 1, 2001-February 8, 2019.
The rub
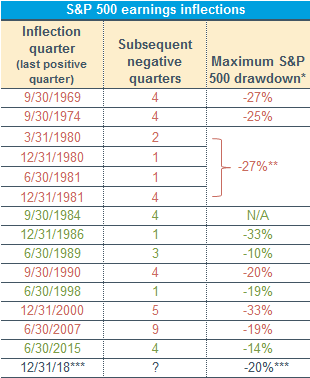
One possible chink in armor of the analysis above is if we do head into a quarter or more of negative year-over-year earnings. As noted above, so far only this year’s first quarter has a negative consensus expectation; with a rebound expected in the subsequent quarters. But a look back in history is potentially instructive around periods when earnings went from positive to negative—even if only for a quarter.
Since 1969, there have been 14 prior periods when earnings inflected from positive to negative; and in all cases except one (1984), there was a fairly meaningful drawdown by the S&P 500 (shown in the table below in price-only terms and rounded) in the five quarters spanning from the quarter prior to the inflection quarter to four quarters after the inflection. (I went back one quarter from the inflection given the stock market’s tendency to move in anticipation of earnings.)*
Source: Charles Schwab, Bloomberg, I/B/E/S data from Refinitiv, as of February 8, 2019.
Given the back-to-back economic recessions which occurred in the early-1980s and the cluster of earnings inflection points, I blended that period into one for the purpose of calculating the maximum drawdown.** As for the final row of the column, we of course don’t yet know whether 1Q19 earnings will indeed be negative, but for what it’s worth, there was a drawdown leading into that possible inflection point in last year’s fourth quarter.***
To add some math to the analysis above, as you’ll see in the color-coding, nine (in red) of these prior earnings inflection points occurred around economic recessions, with the average maximum drawdown being -25%. The other five (in green) were not associated with economic recessions, with the average maximum drawdown being a lesser -15%.
It’s often said that earnings are the mother’s milk of stock prices, and there’s validity to that. At times though, if the earnings bar gets set sufficiently low to allow companies to scale the lowered bar, it’s been a healthy backdrop for stocks. The rub is if earnings move into negative territory; which has historically ushered in double-digit maximum drawdowns—with only one exception since 1969. Whether last quarter’s near-bear market in stocks was sufficient to price in the possible dip into earnings negativity this quarter could be decided by whether we are heading into a recession in the next year. At this point, I still believe an earnings recession is more likely than an economic recession, but investors need to be on guard for the warning signs that the length of runway between now and the next economic recession is getting shorter.
Important Disclosures:
The information provided here is for general informational purposes only and should not be considered an individualized recommendation or personalized investment advice. The investment strategies mentioned here may not be suitable for everyone. Each investor needs to review an investment strategy for his or her own particular situation before making any investment decision.
All expressions of opinion are subject to change without notice in reaction to shifting market conditions. Data contained herein from third-party providers is obtained from what are considered reliable sources. However, its accuracy, completeness or reliability cannot be guaranteed.
Examples provided are for illustrative purposes only and not intended to be reflective of results you can expect to achieve.
©2019 Charles Schwab & Co., Inc. All rights reserved. Member SIPC.
© Charles Schwab
Read more commentaries by Charles Schwab