While recent market performance reflects optimism over potential geopolitical de-escalation, underlying economic data reveals a complex landscape of intensifying price pressures and cooling growth.
The traditional 60/40 portfolio is undergoing a structural renovation, but the fixed income sleeve is proving difficult to stabilize.
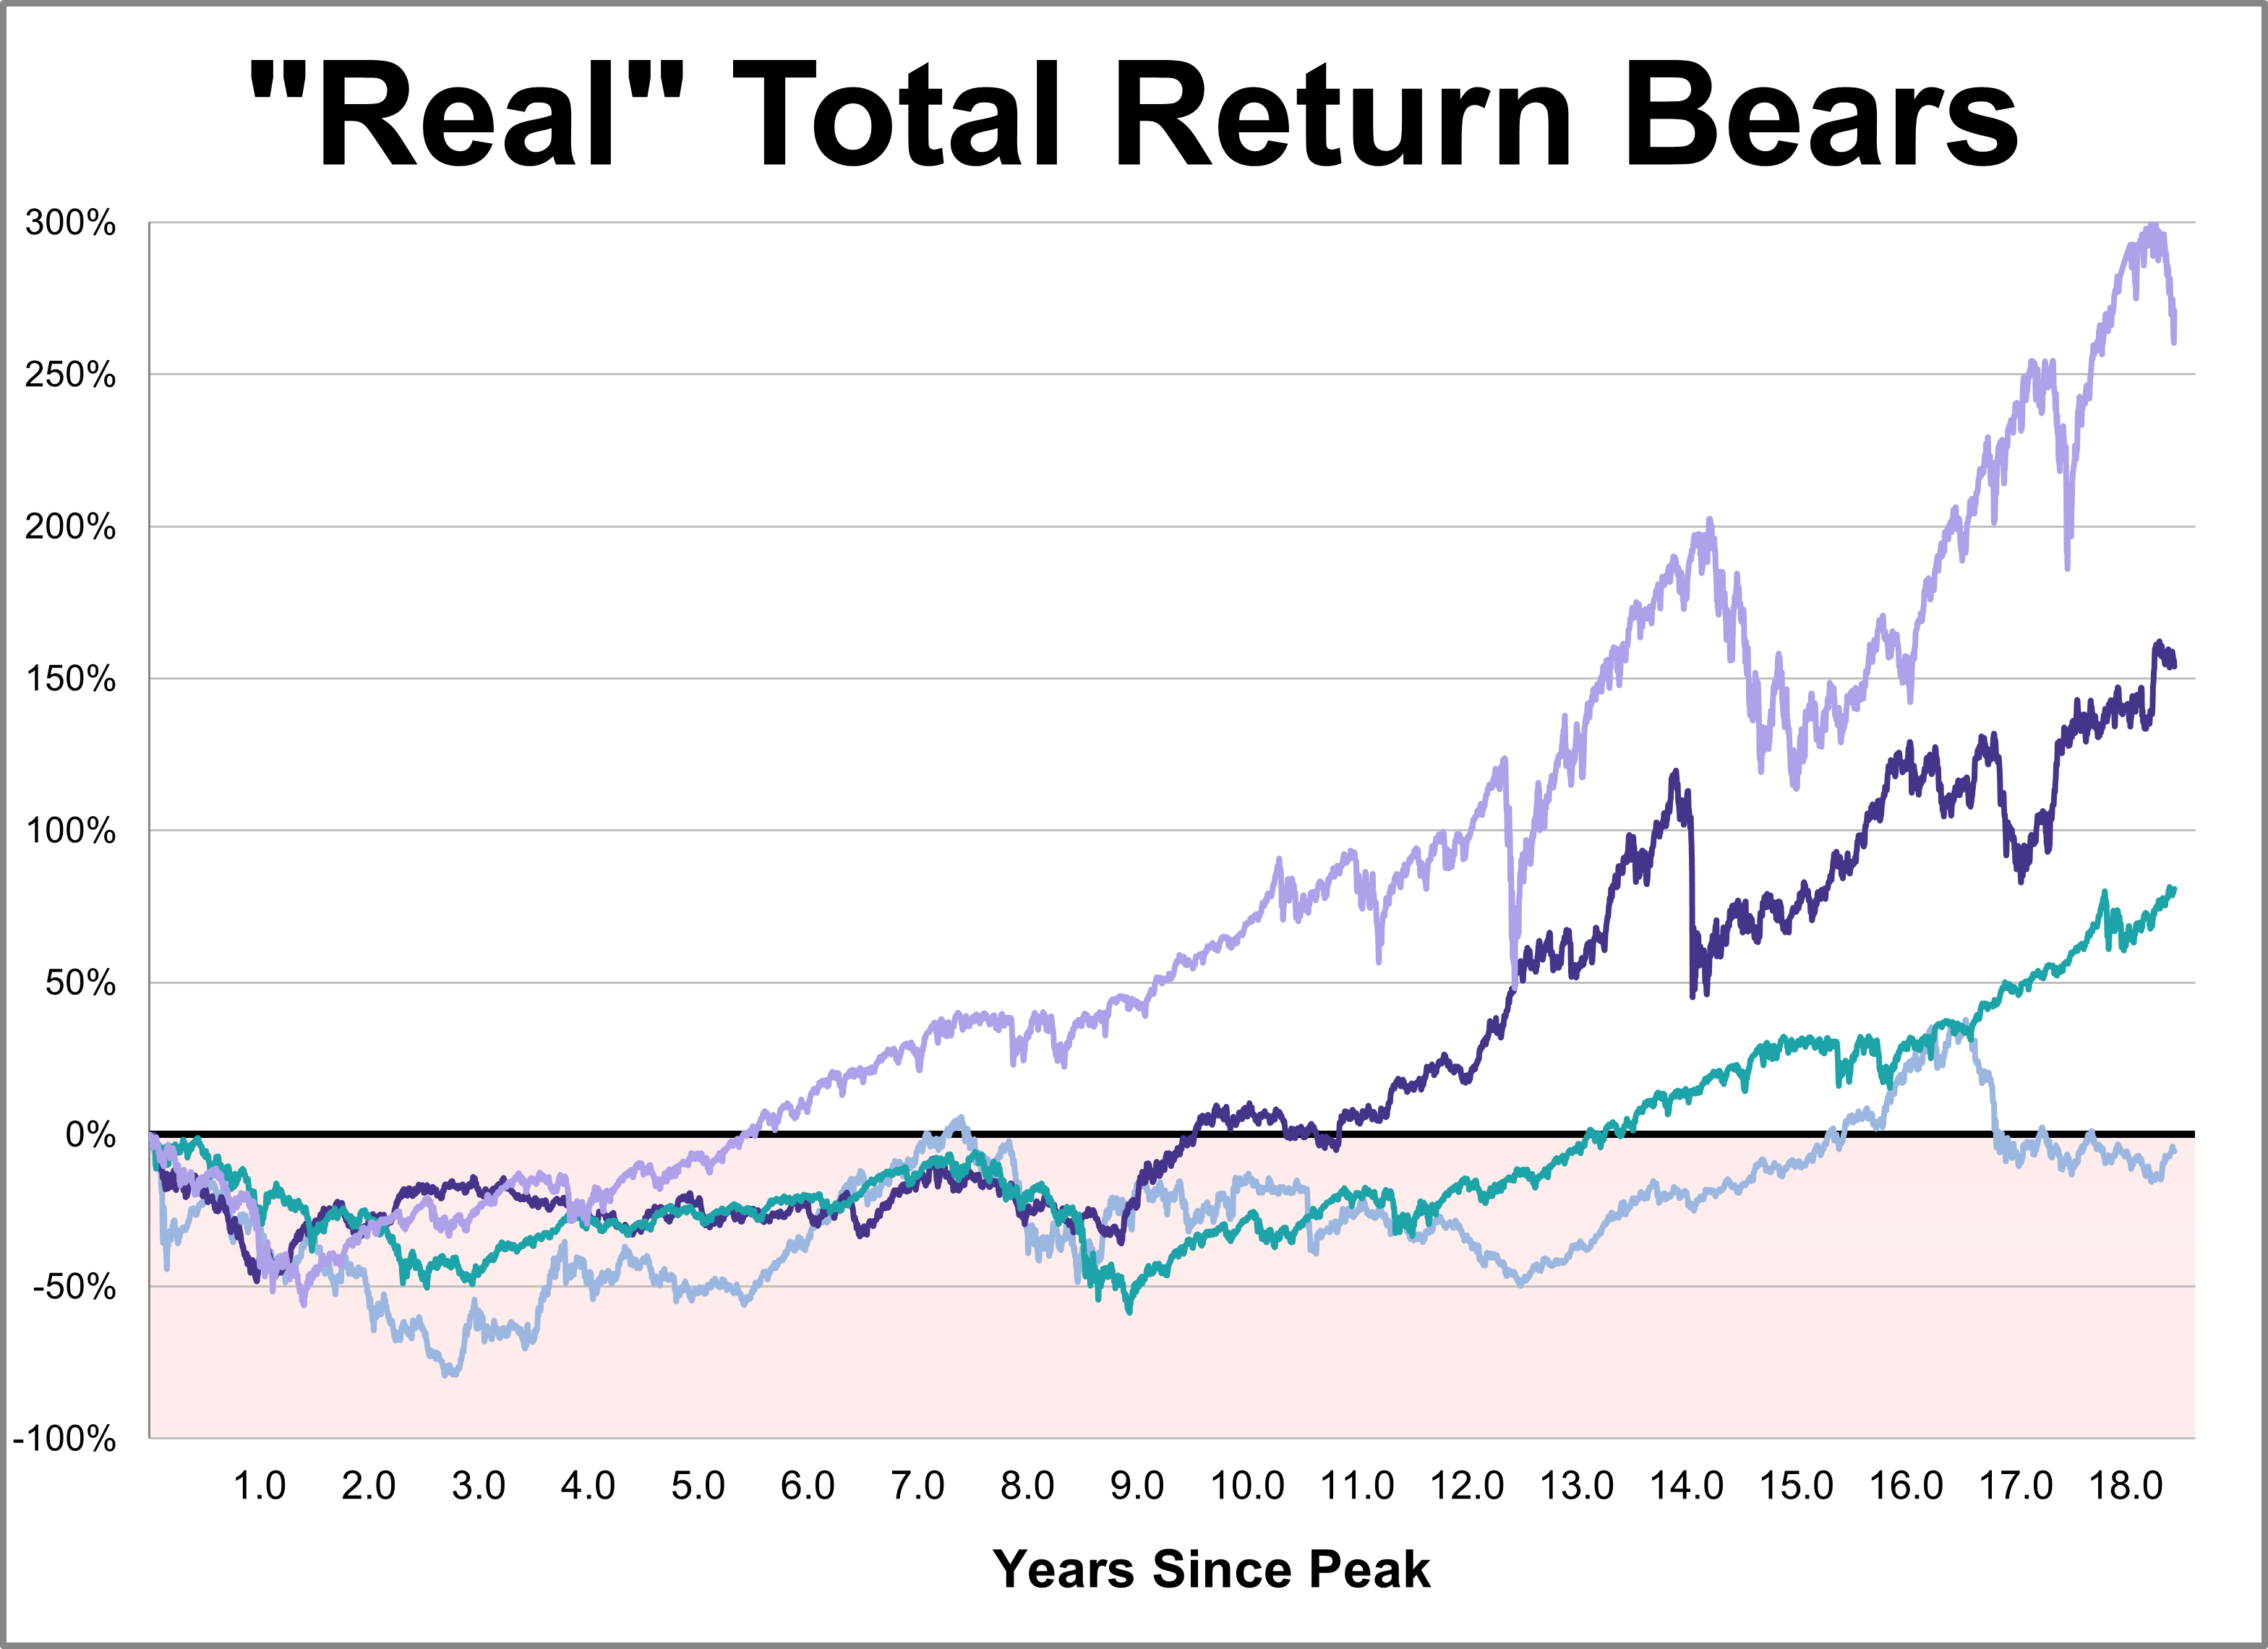
While every market downturn is unique, history offers a crucial lens for understanding recovery. This chart series provides a comprehensive overlay of the Four Bad Bears in U.S. history since the 1929 peak, comparing their recovery paths through the S&P 500's close on March 31, 2026.
Learn how advisors can optimize late-start 529 plans using superfunding, SECURE 2.0 Roth rollovers, and multi-scenario modeling.
Discover how abrdn’s K-1 free ETF outpaced gold and the S&P 500 in March 2026 by providing broad, tax-efficient commodities exposure.
529 Plans are a huge part of many families' investing lives, but up until recently rarely involved advisors. Could that change?
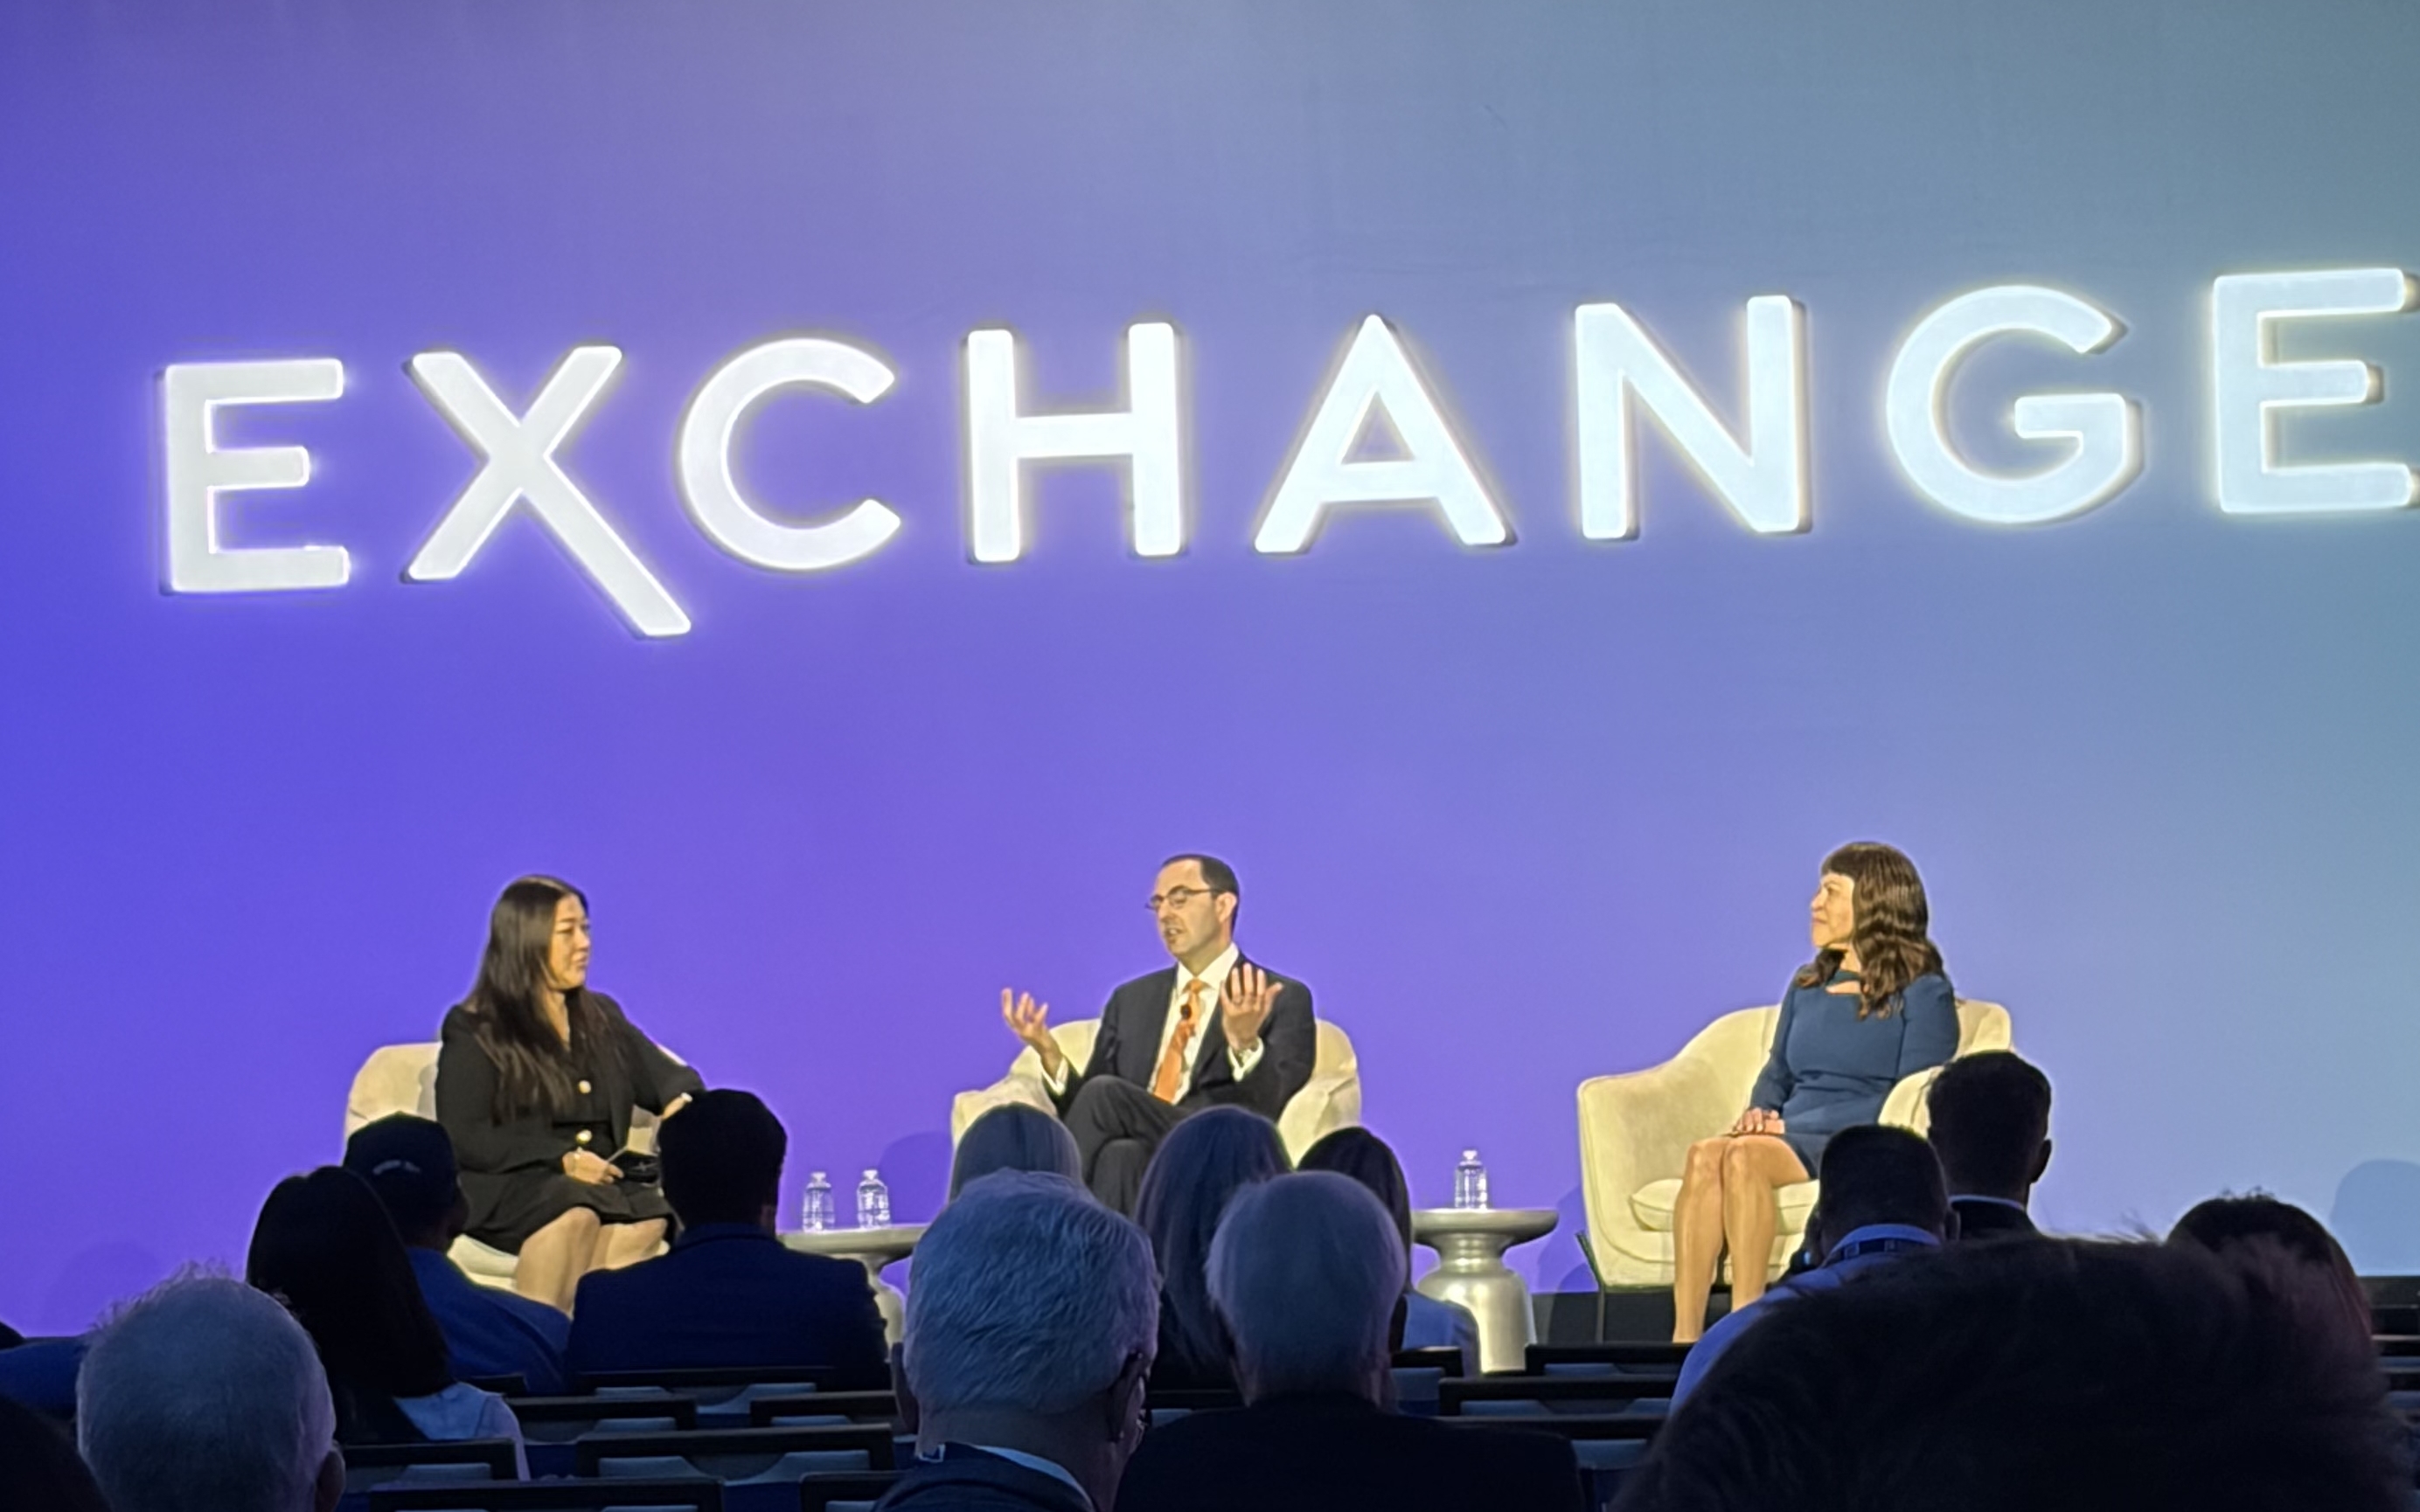
An Exchange conference panel explored bitcoin's evolving role, allocation tactics, and ETF structures for advisors building crypto portfolios.
Heavily influenced by escalating geopolitical conflicts, last week's economic snapshot reveals a sharp erosion of confidence among consumers and investors alike.
The convergence of ETFs, mutual funds, and tokenization is gaining momentum as asset managers seek to modernize product structures, expand distribution, and future-proof their businesses without abandoning established regulatory frameworks.
ETF fees are falling, along with mutual fund fees, according to a new report looking back over multiple decades.
The U.S. middle market has hit $25 trillion. Discover why Cerulli says the advisor shortage and shifting demographics make early engagement a necessity.
Learn how RIAs are using Section 351 ETF conversions to modernize SMA strategies, defer capital gains, and boost firm valuation.
Industry experts at Exchange 2026 explored why only a quarter of advisors have formal succession planning in place and what it takes to execute well.
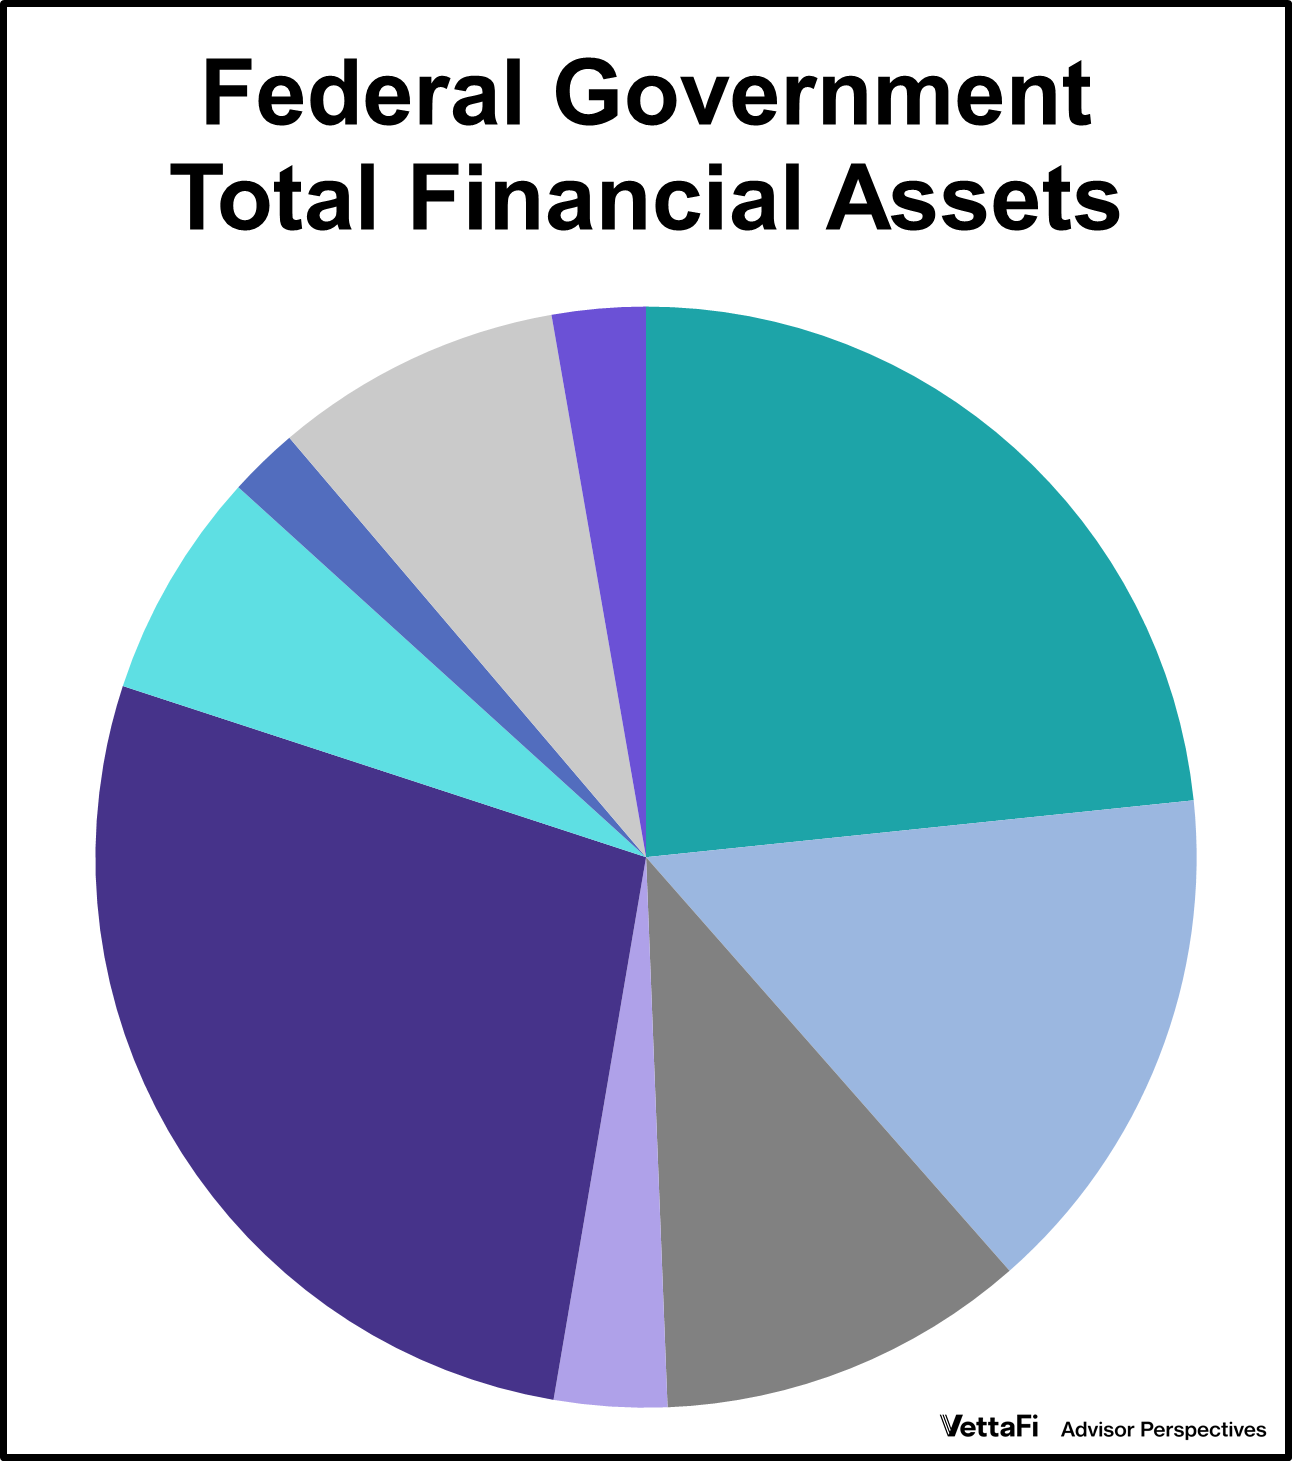
When we think of the U.S. government's finances, we often focus on the massive debt. But what about the assets? What does Uncle Sam actually own, and which asset is the largest?
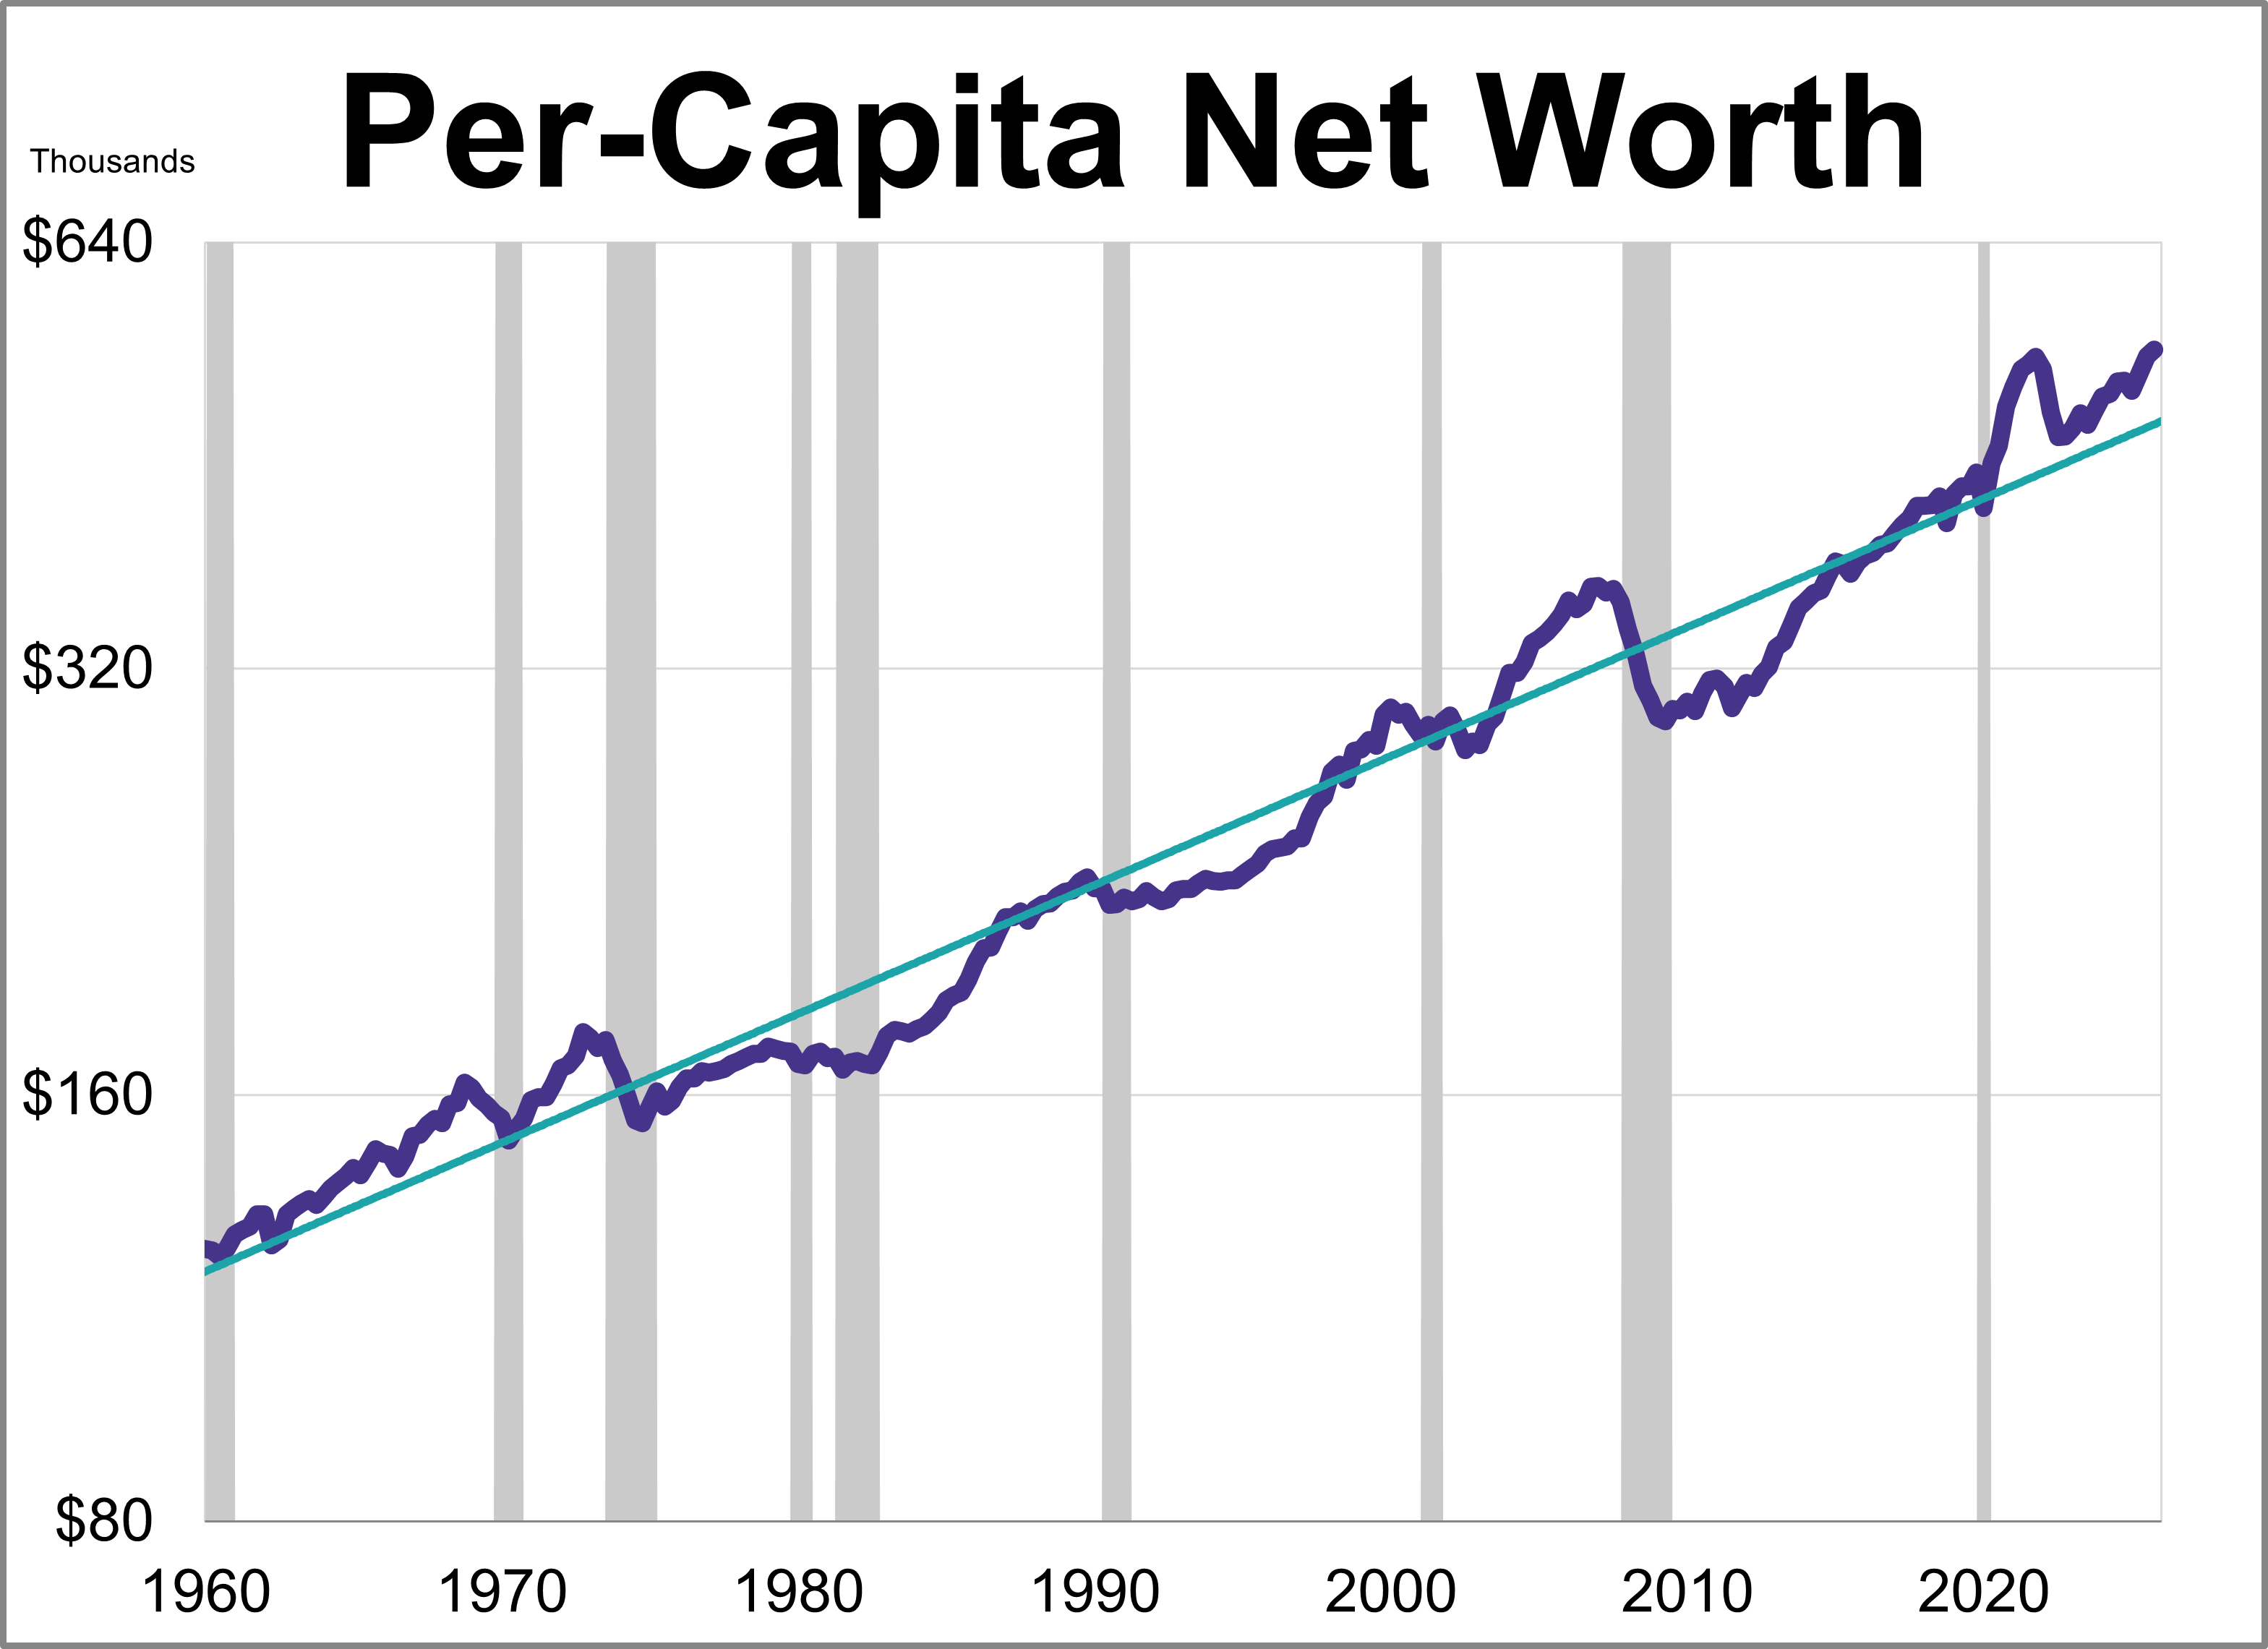
How much wealthier are Americans since the Great Recession? While a look at the headlines shows a staggering 211% increase in household net worth since 2009, adjusting for inflation tells a much different story.
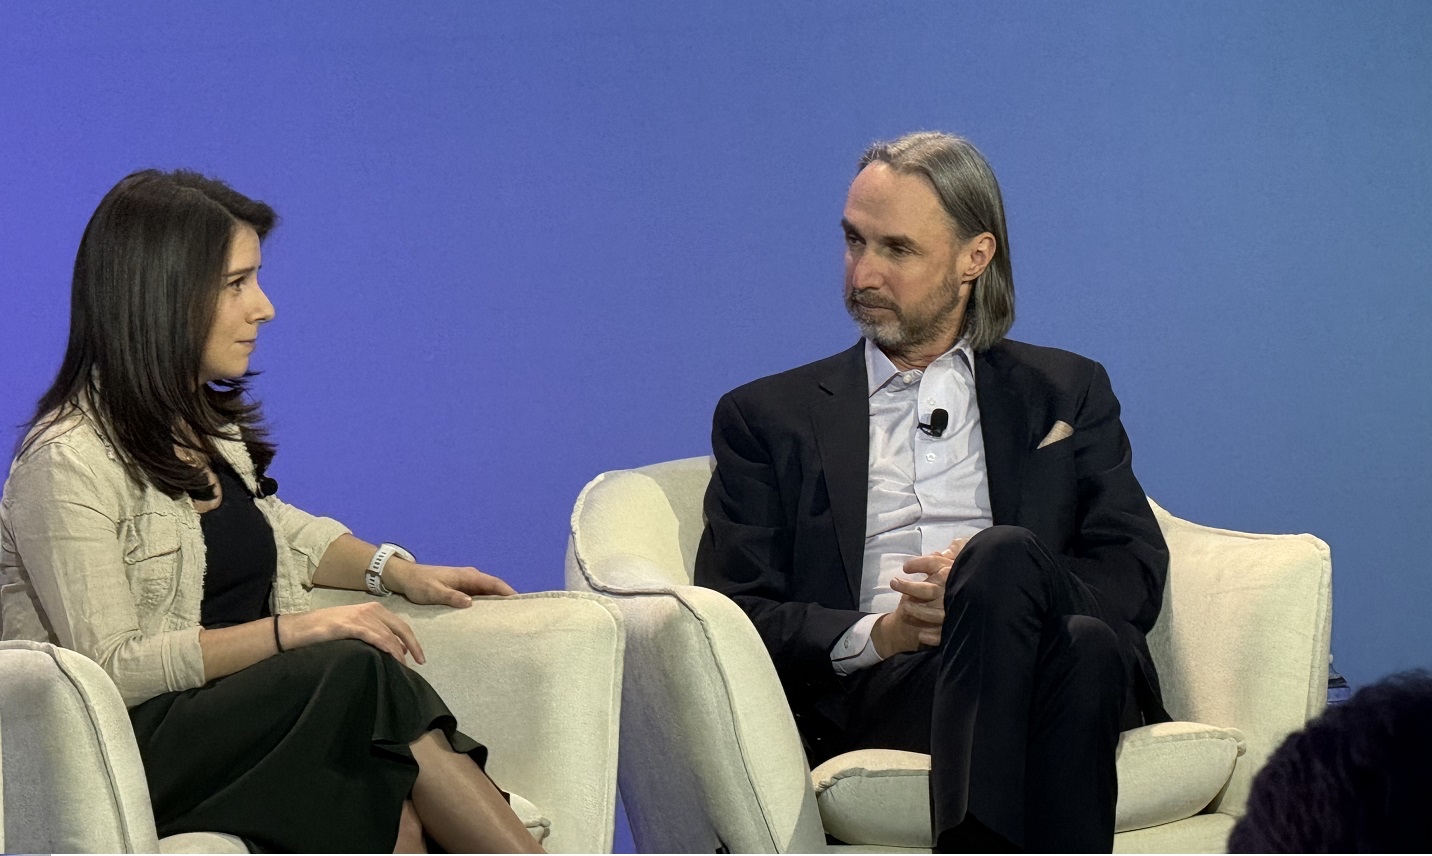
Jeffrey Sherman of DoubleLine provided a candid assessment of the Federal Reserve's current trajectory and fixed income at Exchange.
History made: Dimensional launches first active ETF share class. Access 40 years of micro-cap expertise in a tax-efficient ETF wrapper.
Muni bonds have been a strong performer so far in 2026, benefitting from an important transition to the ETF wrapper from mutual funds.
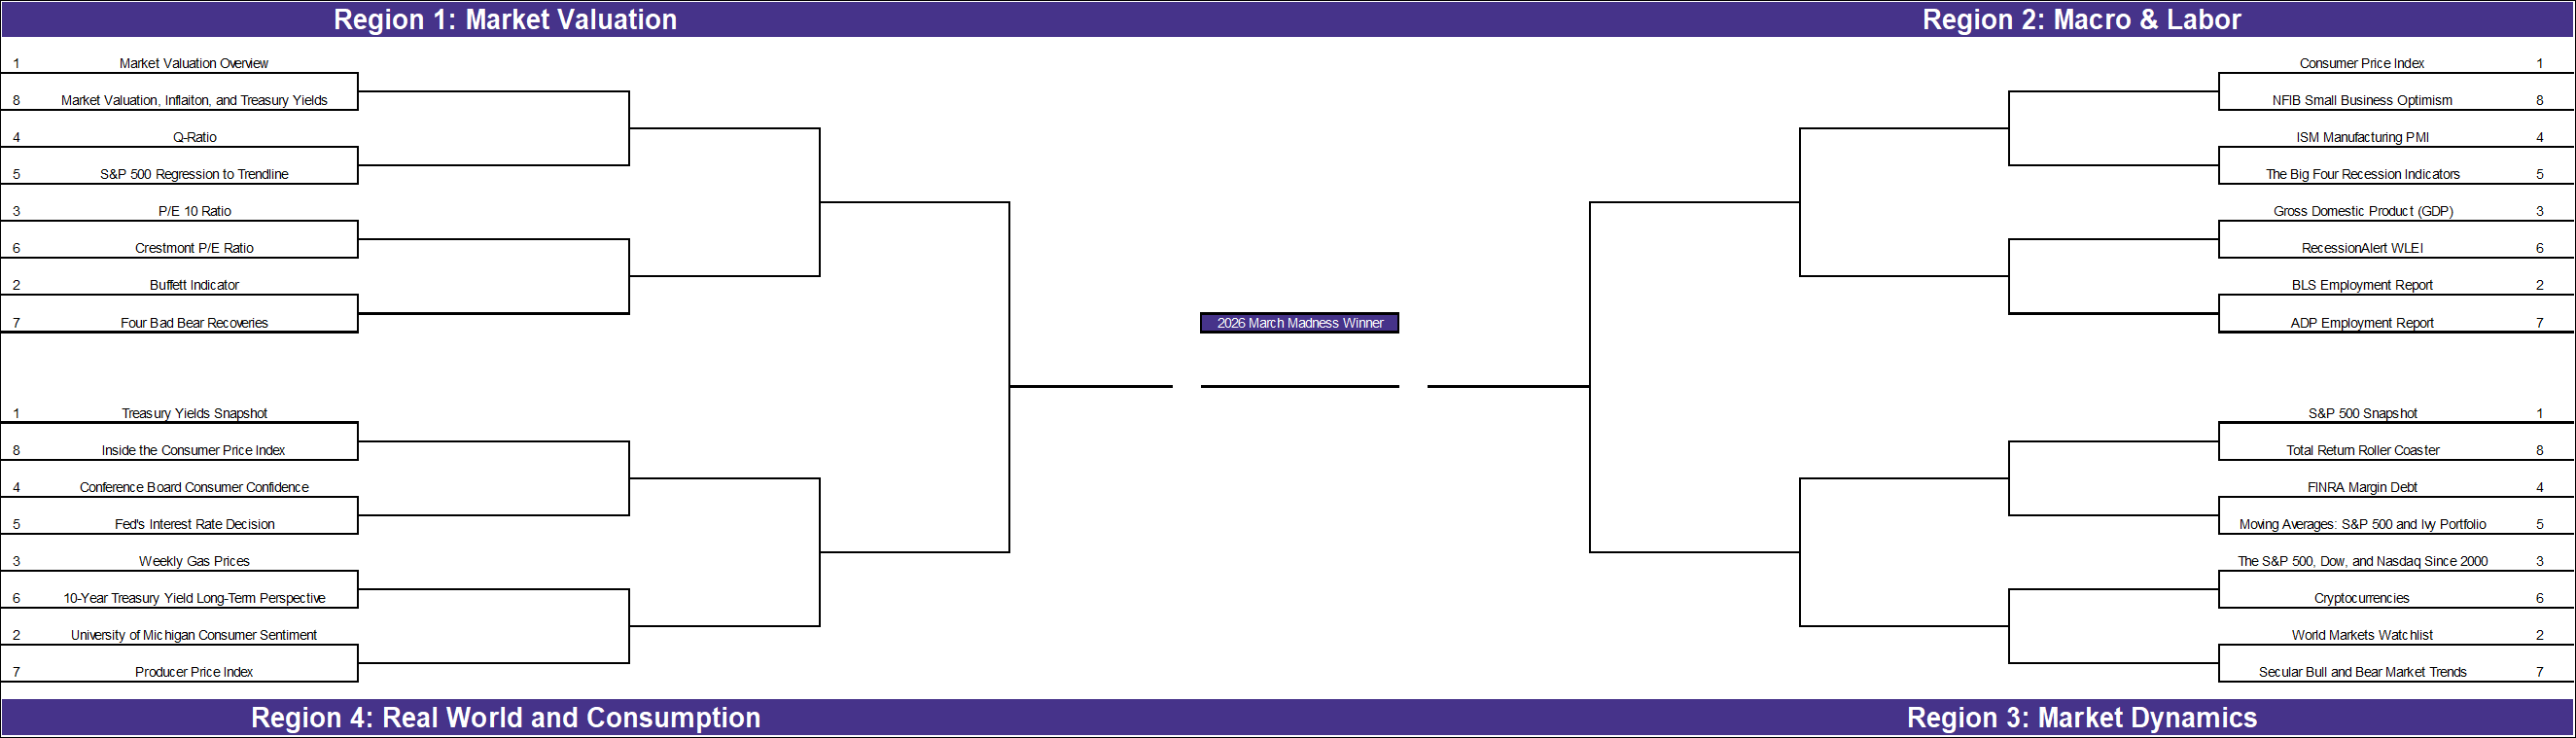
With the NCAA tournament beginning in just a few days, we’ve applied the bracket format to our own research. While economic theory often dictates what should be most important to investors, our reader engagement reveals which topics truly commanded investor attention over the past year.
February saw more than 50 new ETF launches according to ETF Database data, with some standout offerings to note.
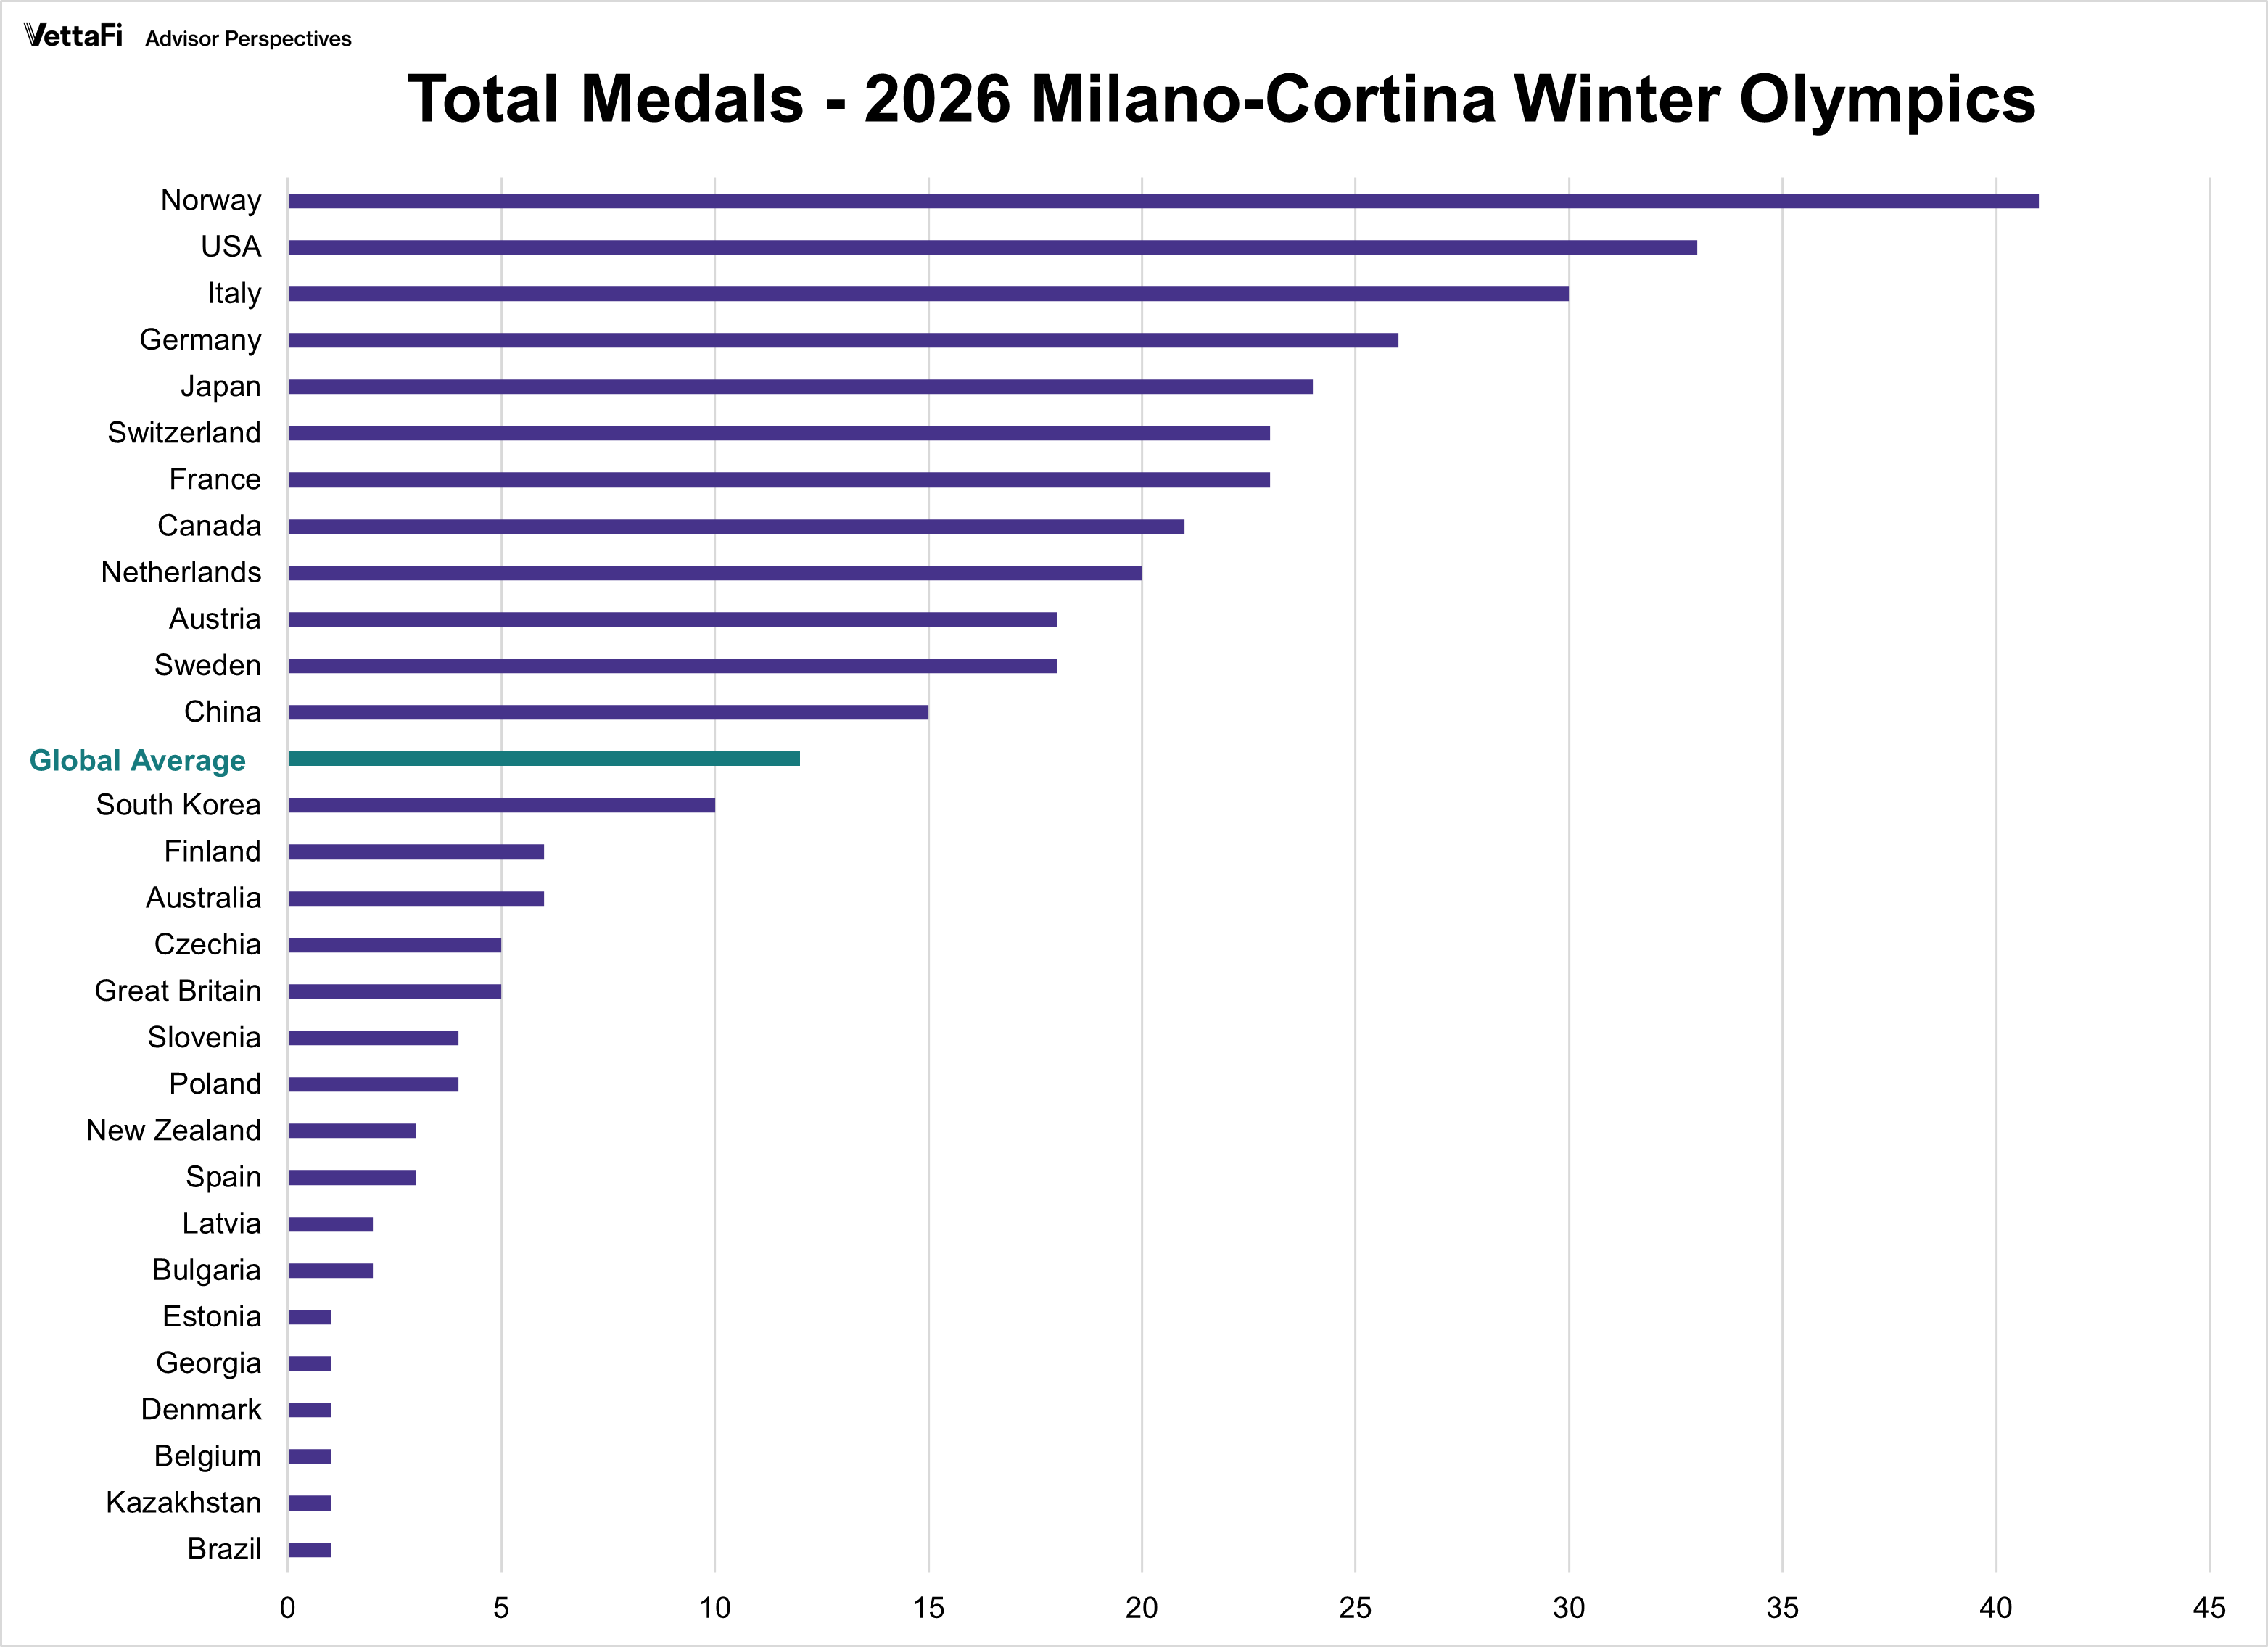
The Milano-Cortina 2026 Winter Games concluded with a familiar hierarchy at the top of the medal table. But in the world of economic indicators, we rarely look at totals without normalizing for scale. The 2026 Winter Games are no different.
A guide to helping HNW investors align tax efficiency with philanthropy, retirement strategy, and multi-generational wealth transfer planning.
From real estate to multi-generational planning, learn the key strategies high-net-worth individuals use to maximize wealth and legacy.
With uncertainty rising through geopolitical conflict, AI risk, and inflation, ETFs that offer greater portfolio control may be the way to go.
It’s no secret for financial advisors today that cracking the millennial client base is a key part of their work. Every day, U.S. millennials inherit major sums of money and are unsure of how to steward their new assets.
Wealth management tech helps RIAs scale, but integration challenges and learning curves remain barriers to maximizing effectiveness.
The U.S. economy sent conflicting signals last week as a sharp deceleration in growth collided with unexpectedly stubborn inflation.
Advisors can foster a stronger relationship with their clients through providing advice over charitable giving.
The U.S. economy began 2026 with a display of unexpected resilience in the labor market and cooling inflation.
SEC White Paper: Do fund mergers lower fees? Explore how economies of scale impact expense ratios and performance for ETFs and mutual funds.
The surge in active ETF launches aligns with broader market trends. For example, active ETF strategies accounted for roughly 60% of new ETF launches in the early months of 2025, underscoring the category’s growing momentum and advisor interest.
The U.S. labor market showed further signs of cooling last week as private sector hiring slowed and job openings reached their lowest levels in over five years.
Vanguard CIO Lauren Wilkinson shares a strategic roadmap for RIAs curious about AI integration for their practice.
ETF industry and State Street Investment Management leader Matt Bartolini joined VettaFi's Todd Rosenbluth to talk diversification.
Throughout most of 2025, silver has recently outperformed gold, proving (ironically) that it is not always second place. Strength in silver built gradually through last year, but the latest pullbacks are a reminder that near-term market reactions can outweigh fundamentals and long-term investor sentiment.
Active fixed income ETFs stand out amid the broader transition from mutual funds to ETFs, with DSCO a recent switch.
The ETF industry has carried its record-breaking momentum from 2025, surpassing $100 billion in flows before the end of January.
In a move that underscores the relentless downward pressure on investment costs, Vanguard announced that it has slashed fees for 84 mutual fund and exchange-traded share classes. These reductions, spanning 53 different funds, represent nearly $250 million in estimated savings for investors in 2026 alone.
The final week of January saw a stark divergence between official policy and the American consumer's outlook. While the Federal Reserve maintained a "solid" view of economic growth, the public’s mood plummeted to a decade-low as sticky amid sticky wholesale inflation.
The U.S. economy continues to display a complex mix of resilience and persistence. As markets brace for next week’s FOMC meeting, this snapshot breaks down the latest shifts in GDP, inflation, and consumer behavior.
Recent acquisition deals highlight asset managers’ race to capture the booming demand for model portfolios and outsourced investment solutions.
The champagne has gone flat. After months of planning the great breakaway, signing independence paperwork, and celebrating freedom from wirehouse constraints, newly minted registered investment advisors (RIA) owners face a sobering reality. They've traded a boss for a back-office burden that's quietly strangling their growth.
As the second half of January begins, the U.S. economy presents a picture of cooling inflation and resilient consumer activity.
Market experts from the WisdomTree recently discussed how the market is responding to the latest headlines, and where opportunities lie.
DoubleLine CEO/CIO Jeffrey Gundlach looked back at 2025 and ahead in 2026 for opportunities, with charts to support his assertions.
JPMorgan Chase and Delta Air Lines have both posted fascinating Q4 earnings, creating compelling opportunities for crafty advisors.
As the S&P 500 continues its record-breaking ascent into early 2026, financial advisors are prioritizing diversification.
Rising operational costs & complex market conditions are forcing some advisors to reconsider how they deliver investment insights to clients.
The ETF ecosystem grew once more in December with more than 100 new launches joining the fray. Three funds invite a closer look.
JPAPM forecasts the global fixed income ETF market to grow to $6 trillion by 2030, up from approximately $3.2 trillion today.